
Trending

Written by: Przemyslaw Radomski, CFA
Previously dismissed, the USDX may now be back with a vengeance. Sentiment is swinging away from shorts and there is an uncanny historical pattern.
With a potential bearish pattern already broken, the USDX is resuming its journey northward. And why is it geared to do well? Is it because the U.S. economy is ripping head? Definitely not - that’s not happening. It’s rather because other regions (think Europe and Japan) are doing even worse.
The dollar’s imminent rise doesn’t mean that gold can’t still experience some very short-term upswing, but for the medium-term, the precious metals continue to face bearish headwinds.
With the greenback laying back and enjoying a well-deserved Easter vacation, gold, silver and the gold miners avoided a dollar-drama for at least another day. However, with the USD Index working to regain its supremacy, along with investors’ respect, the ‘death of the dollar’ narrative has quietly dissipated from the investing zeitgeist.
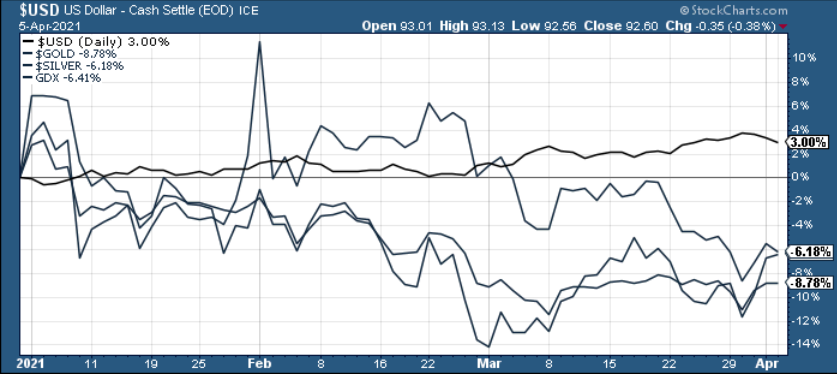
Case in point: the USD Index has broken above its monthly declining resistance line and has already made four new highs since the New Year. More importantly though, because the precious metals have a strong negative correlation with the U.S. dollar, the upward momentum has coincided with an 8.78% drawdown of gold, a 6.18% drawdown of silver and a 6.41% drawdown of the GDX ETF.
Please see below:
And showing no signs of slowing down, with a well-rested USD Index itching to get back to work, we could see ‘business as usual’ in the coming days. On Apr. 2, I warned that a short-term correction could usher the USD Index back to its March high.
That’s exactly what happened yesterday (Apr. 5).
However, with the corrective culmination approaching the finish line, the USD Index remains poised to resume its uptrend.
Adding to the optimism, the tide has already gone out on a sea full of USD Index shorts. And because Warren Buffett once said that “only when the tide goes out do you discover who's been swimming naked,” highly leveraged speculators could be the next to follow.
Please see below:
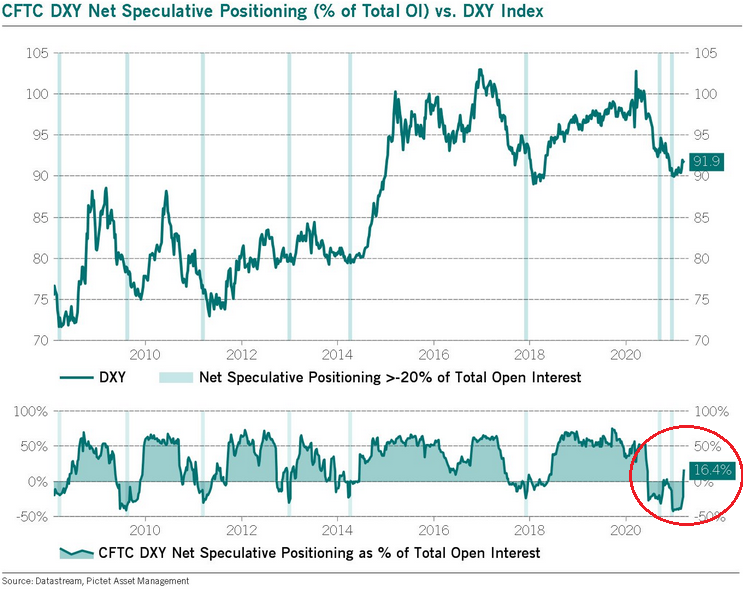
To explain, notice how oversold periods in 2014 and 2018 – where net-speculative short interest as a percentage of total open interest (based on the CoT data) was extremely high – preceded sharp rallies in the USD Index? Thus, with 2021 the most extreme on record, the forthcoming rally should be significant.
How significant? Well, let’s take a look at how things developed in the past – after all, history tends to rhyme.
Wayback Playback
Let’s focus on what happened when the net speculative positions were significantly (!) negative and then they became significantly (!) positive, so without paying attention to tiny moves (like the one that we saw last summer), let’s focus on the more meaningful ones (like the one that we see right now – the net positions just became visibly positive – over 16%, after being very negative for quite some time.
In short, that’s how the following profound rallies started:
- The big 2008 rally (over 16 index points)
- The big 2009 – 2010 rally (over 14 index points)
- The 2011 – 2012 rally (over 11 index points)
- The 2013 rally (“only” over 5 index points)
- The big 2014 – 2015 rally (over 20 index points)
- The 2018 rally (over 15 index points)
The current rally started at about 89, so if the “normal” (the above shows what is the normal course of action) happens, the USD Index is likely to rally to at least 94, but since the 5-index point rally seems to be the data outlier, it might be better to base the target on the remaining 5 cases. Consequently, one could expect the USD Index to rally by at least 11 – 20 index points, based on the net speculative positions alone. This means the upside target area of about 105 – 114.
Consequently, a comeback to the 2020 highs is not only very likely, but also the conservative scenario.
Moreover, let’s keep in mind that the very bullish analogy to the 2018 rally remains intact. Please see below:
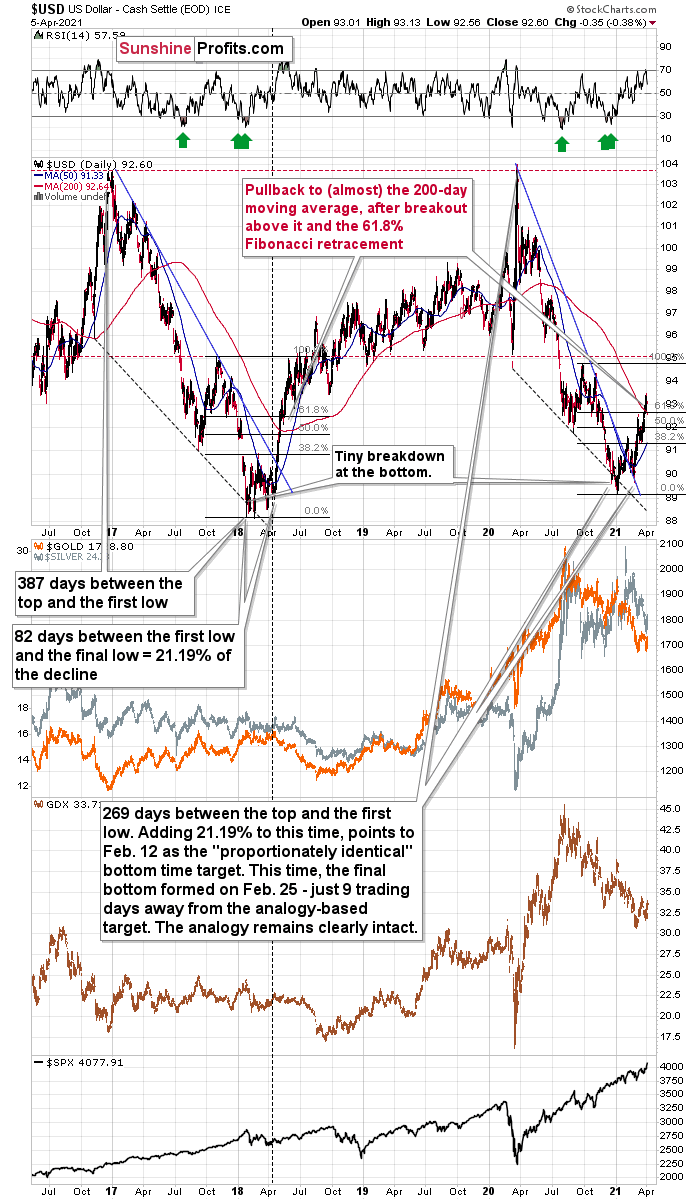
To explain, I wrote on Friday (Apr. 2):
What we saw yesterday definitely qualifies as a small correction. In fact, even if it was doubled it would still be small. And – more importantly – it would be in perfect tune with what happened in 2018 during the big rally.
After rallying visibly above the:
- 93 level
- 200-day moving average
- 61.8% Fibonacci retracement level based on the final part of the decline
the USD Index moved back below the 93 level. This happened in May 2018 and it happened last week.
Since both rallies are so similar, it’s nothing odd that we see a pullback in a similar situation.
Back in 2018, the pullback was small and quick. It ended without the USD Index reaching its 200-day moving average. The pullback ended when the USDX moved approximately to its previous high and slightly below the 61.8% Fibonacci retracement.
Applying this to the current situation (previous high at about 92.5, the 61.8% Fibonacci retracement at about 92.7, and the 200-day moving average at 92.66), it seems that the USD Index would be likely to find its bottom in the 92.3 – 92.7 area.
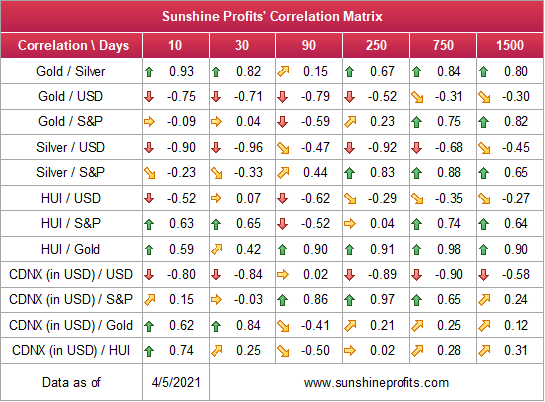
Because of this, the outlook remains profoundly bearish for the gold , silver , and mining stocks over the medium term (even though the next few days are relatively unclear, especially due to gold’s triangle-vertex based reversal that’s due this week ). If you analyze the table below, you can see that the precious metals tend to move inversely to the U.S. dollar.
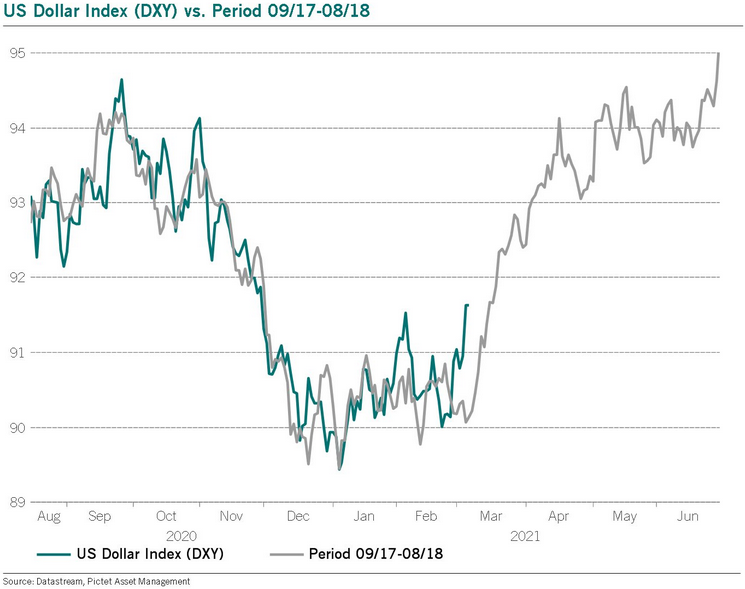
The 2017-2018 Analogue
But as the most important development affecting the precious metals, the USD Index’s 2017-2018 analogue is already unfolding before our eyes. With this version likely to be titled ‘The Resurgence: Part 2,’ while history often rhymes, it’s rare for it to rhyme with this level of specificity . For context, in 2018, the USD Index’s breakout above its 50-day moving average is exactly what added gasoline to the USDX’s 2018 fire. And after the 2018 breakout, the USDX surged back to its previous high. Today, that level is 94.5.
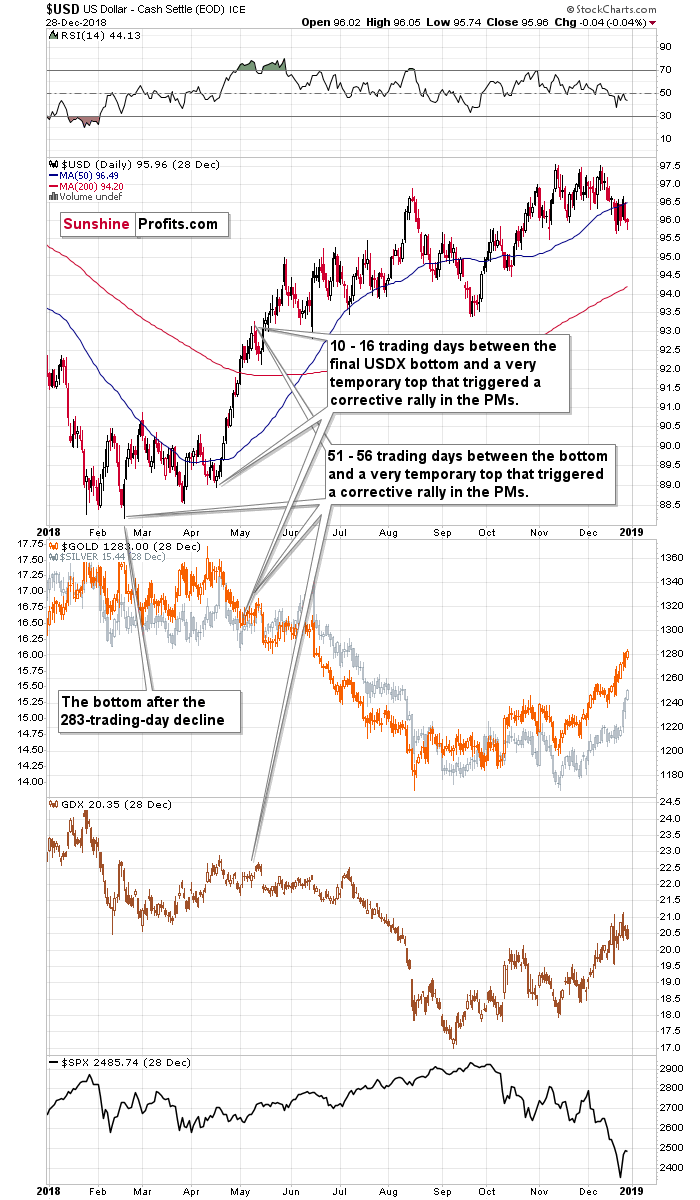
Even more ominous for the precious metals, when the USD Index turned a short-term decline into consolidation in mid-2018, can you guess what happened next? Well, the USD Index moved significantly higher, while gold moved significantly lower.
Please see below:
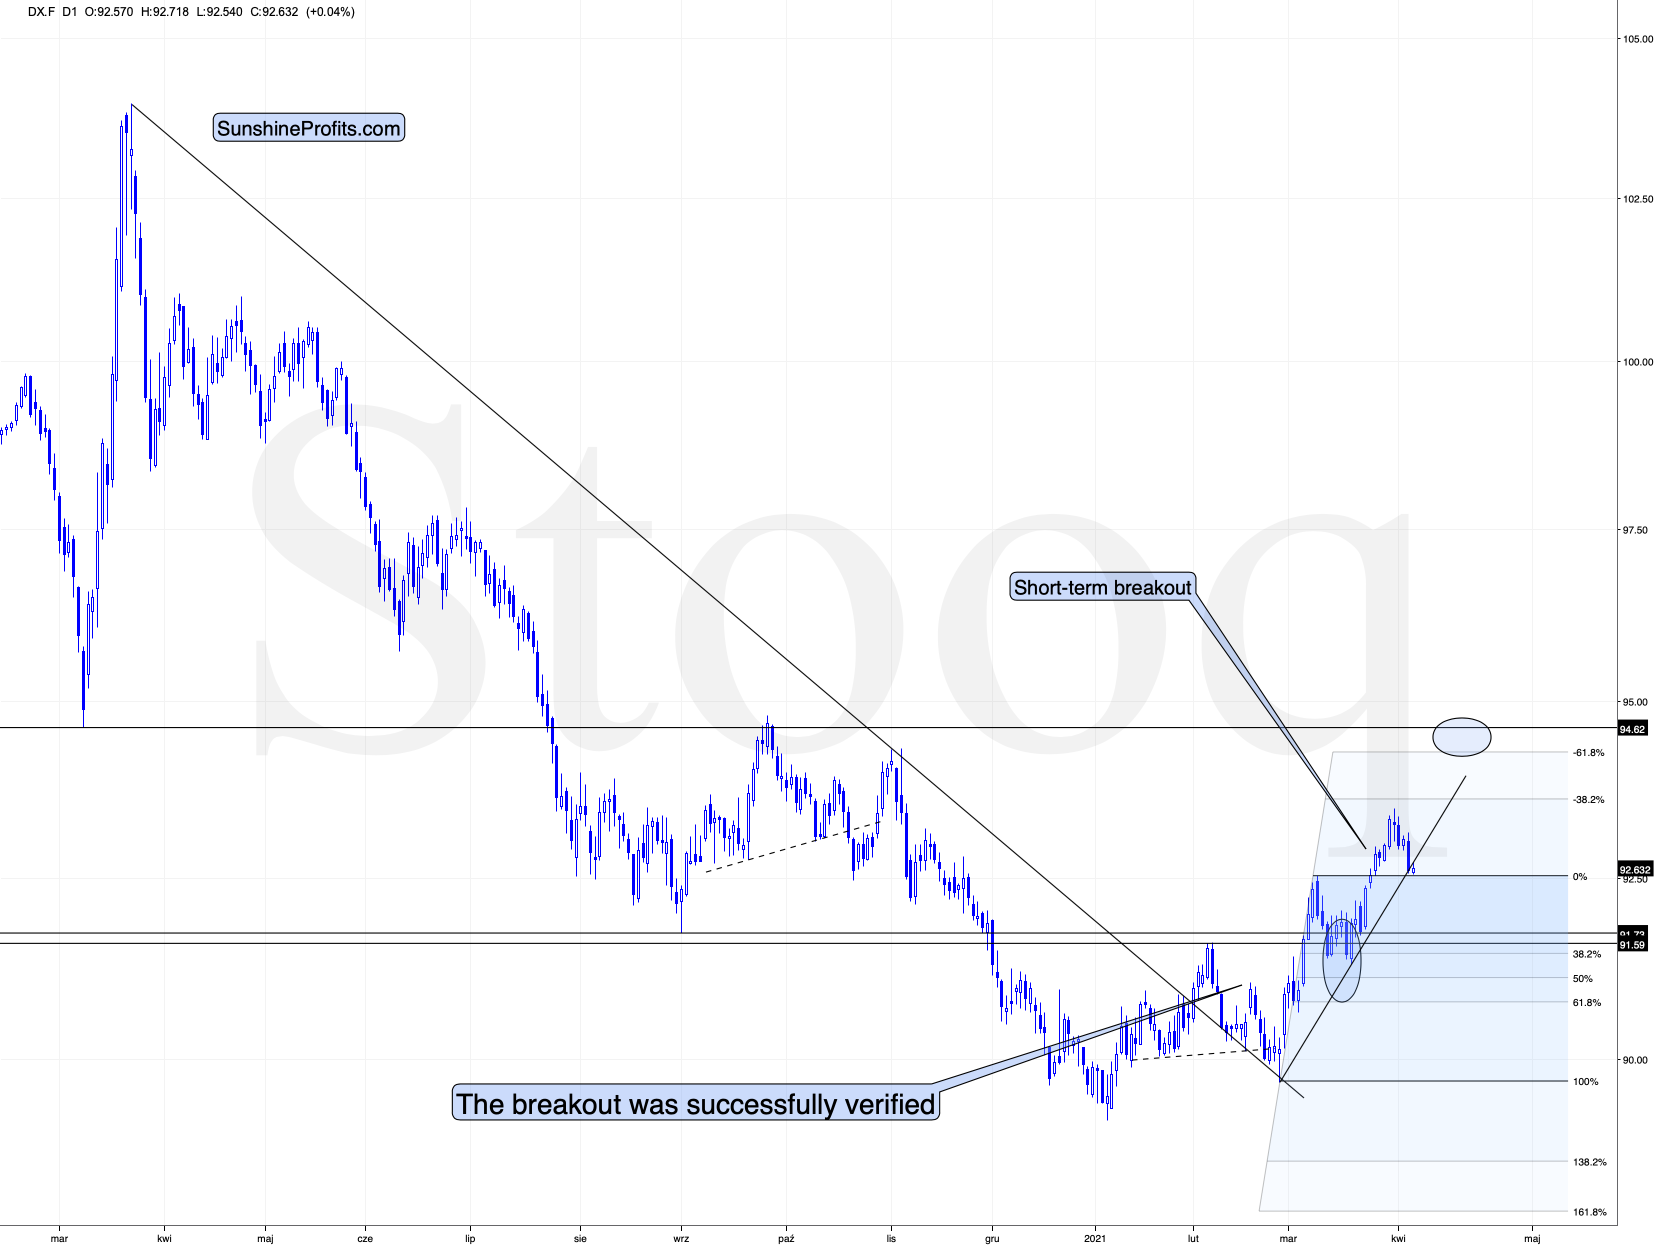
USDX Broke a Potential Bearish Pattern
Likewise, a potentially bearish pattern that I had been monitoring – where the USD Index’s price action from July to October 2020 mirrored the price action from December 2020 to February/March 2021– has officially been broken . With the USD Index’s medium-term breakout trumping the former, the potentially bearish pattern has been invalidated and the USD Index remains on a journey to redemption.
But to what end?
Well, if we look back at 2020, the USD Index attempted to recapture its previous highs. But lacking the upward momentum, the failure was followed by a sharp move lower. Today, however, the USD Index has broken above its previous highs and the greenback verified the breakout by consolidating, moving back toward the previous lows and rising once again. Now, the USD Index is visibly above its previous highs .
Taken together, and given the magnitude of the 2017-2018 upswing , ~94.5 is likely the USD Index’s first stop. And in the months to follow, the USDX will likely exceed 100 at some point over the medium or long term.
No, not because the U.S. is doing so great in economic terms. It’s because it’s doing (and likely to do) better than the Eurozone and Japan, and it’s this relative performance that matters, not the strength of just one single country or monetary area. After all, the USD Index is a weighted average of currency exchange rates and the latter move on a relative basis.
In conclusion, while the USD Index’s decline on Apr. 5 created a goldilocks environment for the precious metals, the latter should have enjoyed a much larger upswing. However, with the U.S. 10-Year Treasury yield jumping by another 2.37% and the precious metals still shaken from a string of false breakouts, their relatively weak performance was quite revealing. Think about it: if gold, silver and the gold miners can’t make up ground when their main adversary retreats, how are they likely to respond when the USD Index regains its mojo? As a result, with the USD Index’s attitude about to shift from accommodating to unkind, gold, silver and the gold miners will likely see lower levels before forming a lasting bottom.
Thank you for reading our free analysis today. Please note that the above is just a small fraction of today’s all-encompassing Gold & Silver Trading Alert. The latter includes multiple premium details such as the targets for gold and mining stocks that could be reached in the next few weeks. If you’d like to read those premium details, we have good news for you. As soon as you sign up for our free gold newsletter, you’ll get a free 7-day no-obligation trial access to our premium Gold & Silver Trading Alerts. It’s really free – sign up today.
Related: Gold Just Can’t Seem to Breakout
The views and opinions expressed in this article are those of the contributor, and do not represent the views of IRIS Media Works and Advisorpedia. Readers should not consider statements made by the contributor as formal recommendations and should consult their financial advisor before making any investment decisions. To read our full disclosure, please click here.