
Written by: Przemyslaw Radomski, CFA
The U.S. Labor Day is almost there, and thus the time for gold’s rally is running out. Tick-tock, tick-tock… and then the party stops.
Chart analysis is a very interesting activity. You need to keep your mind open, your cognitive and emotional biases at bay, you have to stay humble, as you always have something new to discover, and you might need to change your mind in a flash. Moreover, the indications can arrive from all over the place. You can expect that the key signal will come from this price analysis technique, or that one, or maybe based on the price link between some assets. Or it could even be the case that it will not be the price or volume that will be critical in a given situation… but time.
The cyclical nature of many areas of life is present in the markets, and it is usually the case that the seasonal factors have only a mild effect on the prices and other factors are much more important, as they are specific to a given situation. Sometimes, however, we have a recurring event that’s so precise in its implications and so accurate that its importance could dwarf other techniques.
This could be the case with gold’s post-U.S.-Labor-Day performance.
A poet might say that at that time a golden dolphin jumps joyfully into the air, shining briefly in the evening sun, preparing for a deep and dangerous dive.
A data scientist might say that 10 out of 10 efficiency with regard to short-term implications and 8 out of 10 performance with regard to medium-term implications is something that seems opposite to the efficient market theory, even in its weak form.
And a trader might say “great! let’s make some money on it!”
I’ll let you be the judge as to which approach is best, while I will feature my observations regarding gold’s price performance around the U.S. Labor Day.
And yes, I did feature this chart yesterday, but I think I haven’t given enough emphasis on how important it is currently.
We’re now less than one week away from the U.S. Labor Day, which is particularly important for the gold price movement.
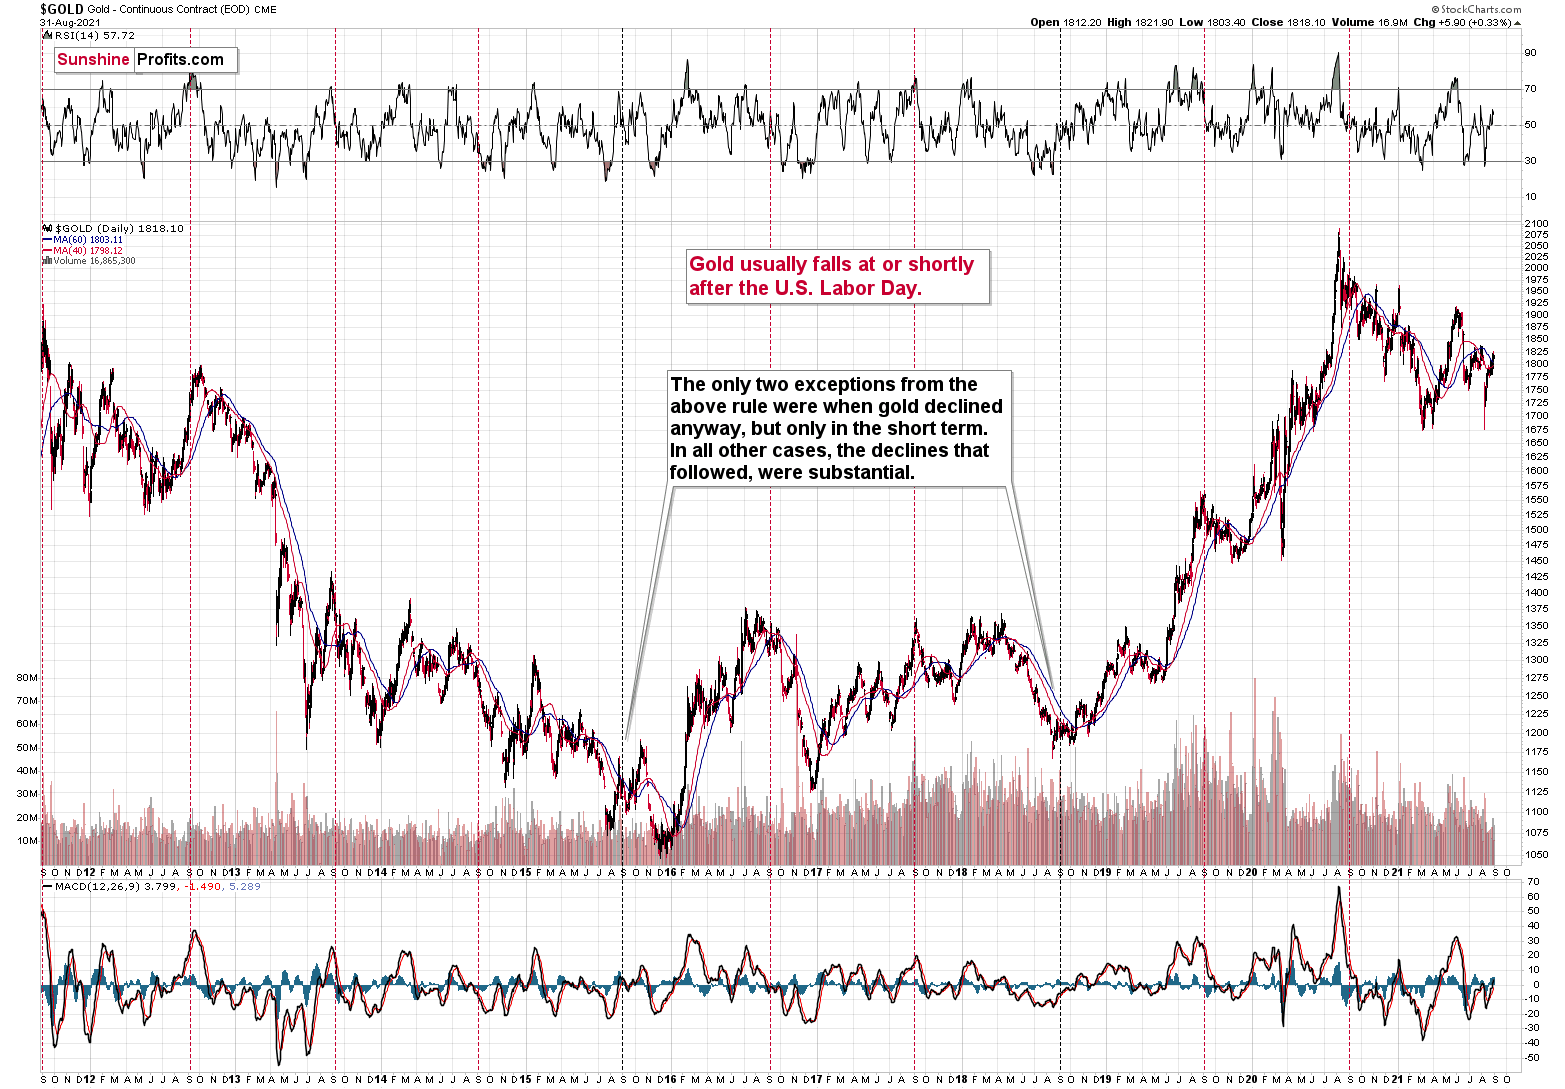
You see, in the previous 10 years, gold almost always declined profoundly right after the U.S. Labor Day — I marked that on the above chart with red, dashed lines. There were only two cases (in 2015 and in 2018) when gold didn’t slide profoundly after that day, but… it was when gold declined in the short term anyway. There was simply no major downswing later.
In other words, in all 10 out of the previous 10 years, gold moved lower in the short term after the U.S. Labor Day. Of course, it’s debatable what one describes as the short term. In this case, I mean a period between a few days and a few weeks. Then again, if you look at the chart, it’s clear what we can expect. Please have a look at how far gold usually fell (red lines) and how far it fell during the exceptionally bullish years when it declined just in the short run.
This is very important, as it tells us that even if gold doesn’t decline this week, it will be very likely to do so based on this surprisingly accurate cyclicality.
Related: Bittersweet Truth for Gold Stocks: What You Need to Know
The views and opinions expressed in this article are those of the contributor, and do not represent the views of IRIS Media Works and Advisorpedia. Readers should not consider statements made by the contributor as formal recommendations and should consult their financial advisor before making any investment decisions. To read our full disclosure, please click here.