
Trending

To appreciate the recent gold price surge, we discuss three critical factors.
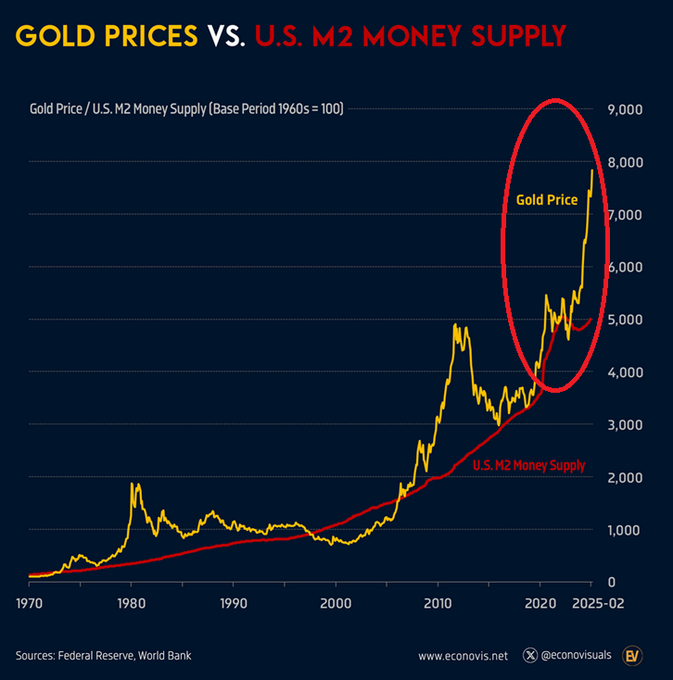
Money Supply—The chart below shows that the ratio of gold to the money supply (M2) and the money supply tend to follow each other, albeit gold prices are more volatile. The ratio is well extended as it was in 2011. In September 2011, gold peaked at nearly $1900 and fell over the next four years to roughly $1000 before resuming its upward trend.
Sentiment/Fear—As we see with the bond term premium, investors are anxious about rising deficits and inflation. The same concerns are also behind the bullish gold sentiment. However, the Fed maintains high real interest rates, i.e., hawkish monetary policy, and the DOGE team is reducing deficits.
Technicals—Gold is trading about 45% above its 200-week moving average, slightly below the 50% premium in 2011. Its MACD and RSI are very extended but not at all-time highs. The positive is that cash flows into gold are steadily rising. However, such was the case in 2011, where they remained elevated for over a year after gold peaked.
Based on the factors above, gold appears to be trading at a premium. The rally may continue, but gold prices are starting to feel and act similar to 2011. QE, zero interest rates, and high deficits following the financial crisis led to bullish sentiment at that time. Further, the growing possibility of economic trouble and debt defaults in the Eurozone were troublesome.
This is not a call to buy or sell gold but a warning that its price is greatly extended. Gold holders should appreciate that a significant decline is possible.
What To Watch
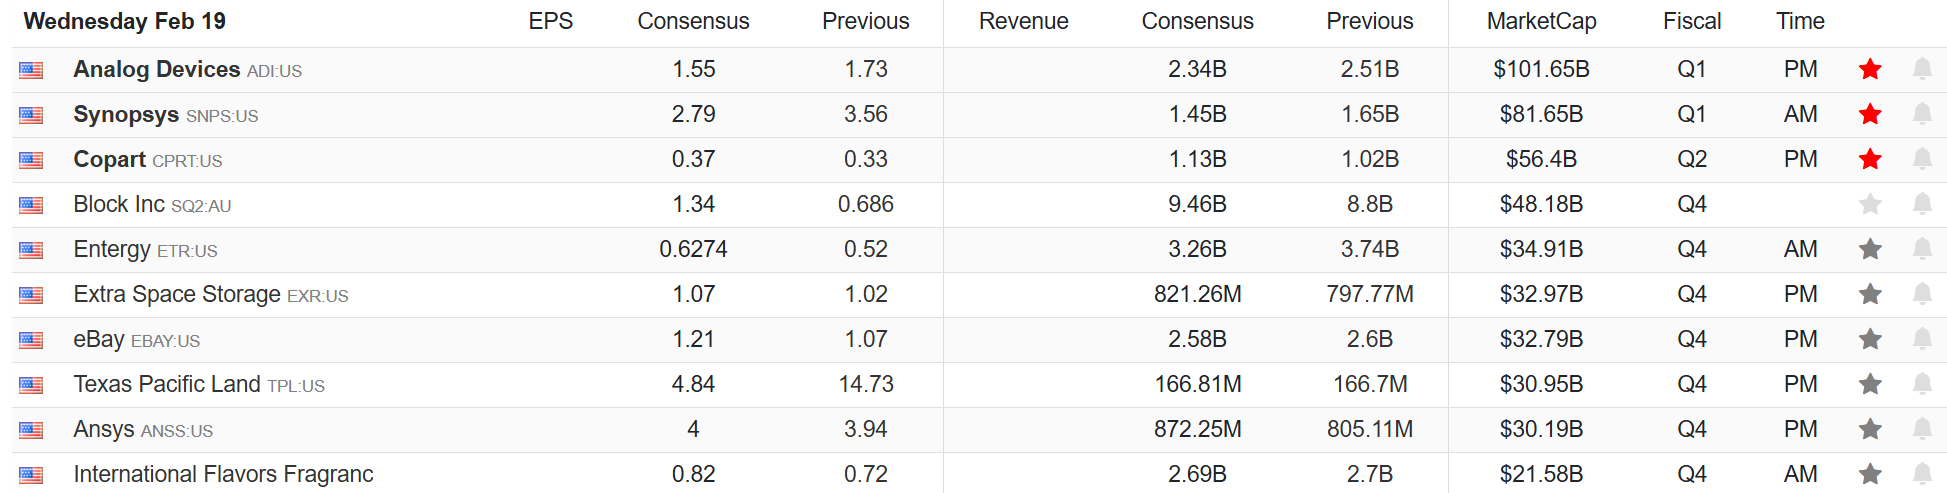
Earnings
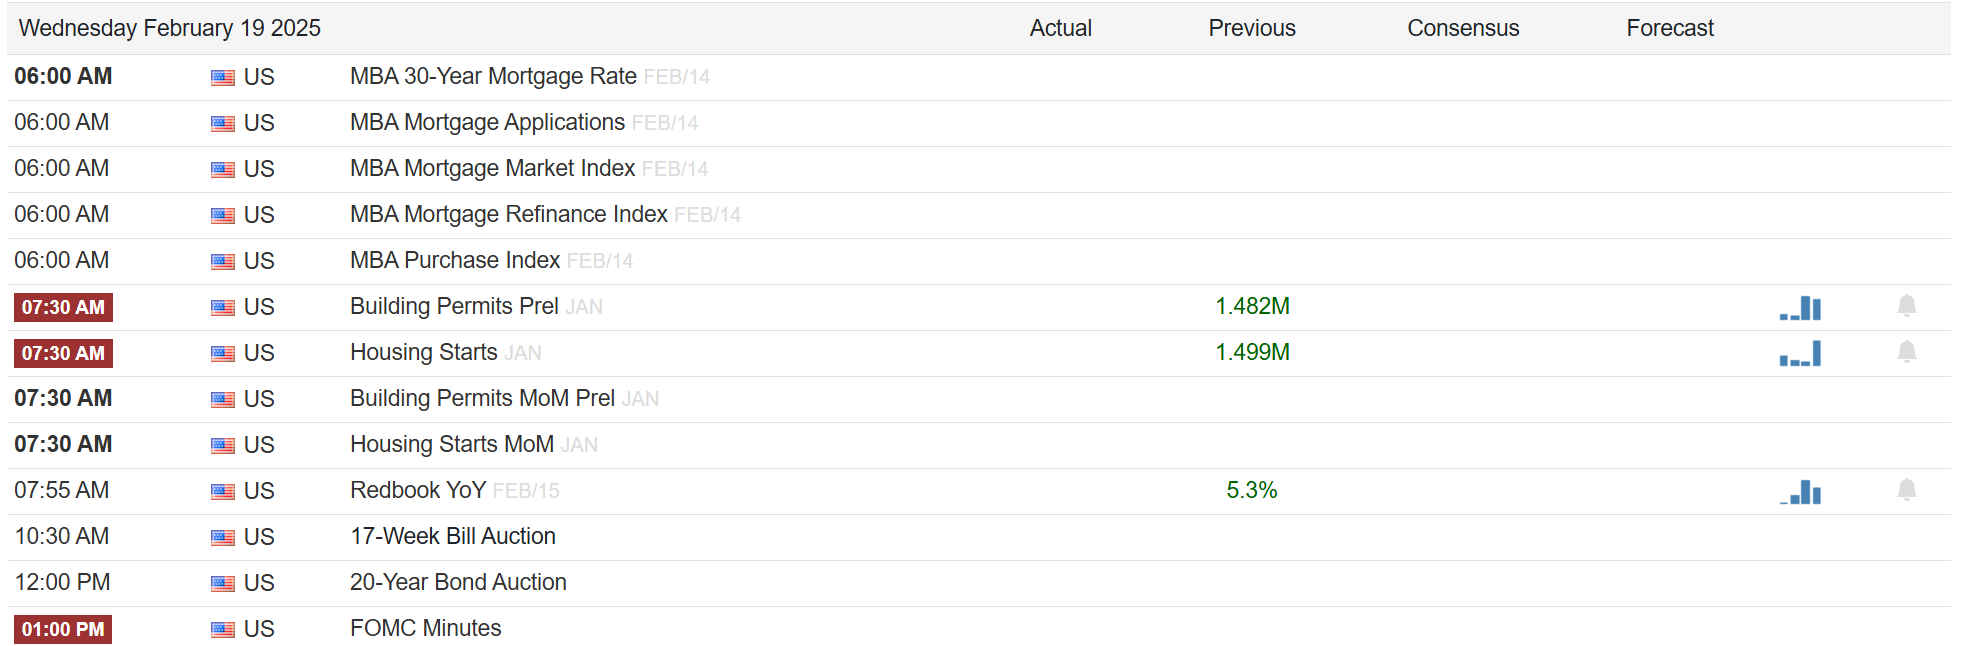
Economy
Market Trading Update
As noted yesterday, the market had rallied to retest old highs and failed at its first test of the previous resistance levels. The most notable loser yesterday was META (META), which we reduced our holding of in the Dividend Equity Growth Model early yesterday morning. The sell-off in META was unsurprising given its historical record run of 20 straight positive days. The run had taken META into grossly overbought conditions, which deviated from its declining money flows. The negative divergence was a clear indication the run would eventually end. The approaching sell signal, combined with the still overbought conditions, suggests the beginning of a more protracted consolidation/correction in META before it can begin its next push higher.

As for the overall market, as noted, the market traded in a volatile range yesterday but surged higher in the last 15 minutes of trading, setting a new all-time high. While the MACD remains on a short-term buy signal, a negative divergence with relative strength remains. However, while the technical warning is at play, money flows remain strongly positive, supporting current market levels. Those money flows are getting very extended with the recent run. If the market can hold above resistance, a higher move is likely. However, I would not be surprised to see a reversal in money flows soon and another short-term pullback.

The backdrop remains supportive of holding equity exposure near target levels. However, continuing your risk management process should not be neglected.
Small & MidCap Stocks Are Lagging
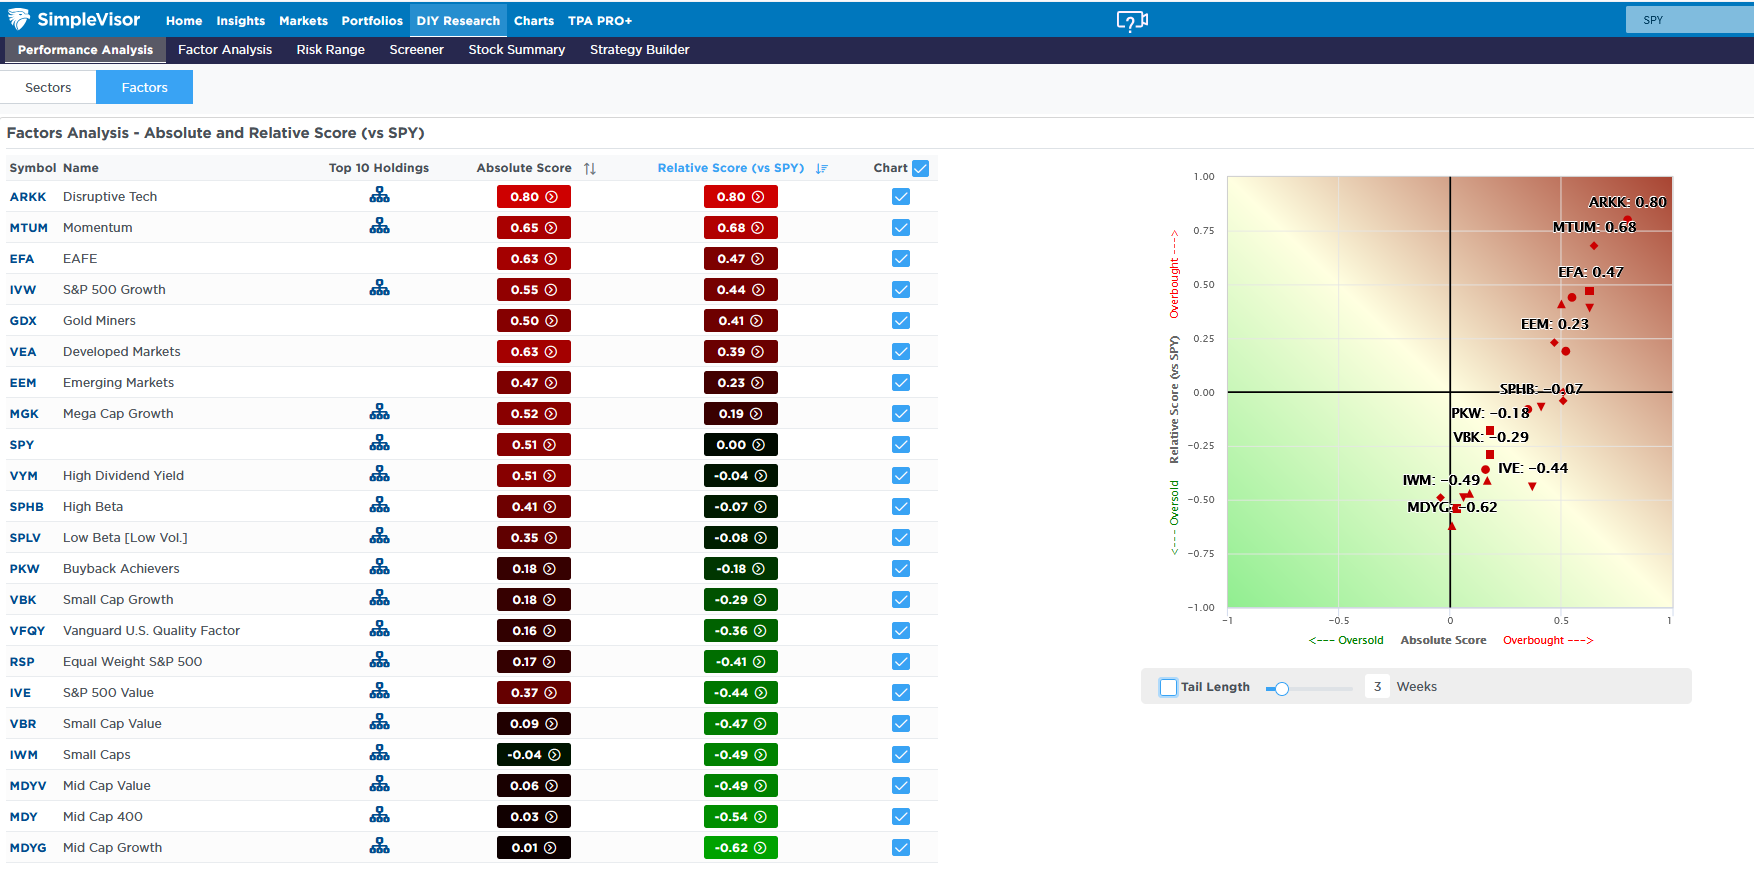
The SimpleVisor table below shows that the recent rally leaves behind the small and midcap sectors and the equal-weighted S&P 500. However, unlike the experience throughout much of 2024, mega-cap growth stocks are not leading the way. Disruptive tech (ARKK) and Momentum stocks have the highest relative scores. While mega-cap stocks have a positive relative score, it’s close enough to zero to say it’s trading at fair value versus the S&P 500.
It’s also worth noting that about half the factors have an absolute score above 50. This denotes that large portions of the market are overbought. Interestingly, only six factors have a relative score between -20 and +20 (fair value). Consequently, a good number of factors have oversold relative scores. When the market corrects, it would not be surprising to see a rotation toward the oversold factors. If such a rotation were to occur, we would suspect that small and mid-cap stocks would lead the way on a relative basis.
Retail Excuberance Sets Up For A Market Correction
Retail investors are expected to become more bullish about increasing equity exposure when markets rise. However, the more extended markets become, the more confident investors are about increasing speculative risk. In other words, “success breeds confidence.” One way we can view retail exuberance is through the use of leverage. As investors become increasingly confident about higher stock prices in the future, they are willing to borrow money to take on more risk. We see this by comparing investor confidence in higher stock prices to the annual rate of change in margin debt.

Tweet of the Day
“Want to achieve better long-term success in managing your portfolio? Here are our 15-trading rules for managing market risks.”
Related: Is Retail Euphoria a Warning Sign? Market Correction Ahead?