
Trending

Written by: Przemyslaw Radomski, CFA
In our globalized economy, currency pairs have a negative correlation with gold, so how does the current EUR/USD situation impact the yellow metal?
It pays to pay attention to what is happening in Europe. As is well known, there are many currency pairs in the world, but the most traded one is the EUR/USD. How does that affect you as a gold investor? The equation goes something like this: if the economy of the Eurozone sinks and takes the EUR down with it, the USD rises – and vice-versa. Gold, which is usually inversely related to the dollar, will also either rise or decline based on the latter’s behavior.
Before we get to Europe though, let’s take a look at what gold is currently doing.
Once again, yesterday’s (Jan. 26) session was relatively uneventful on the technical front, but that doesn’t mean that the outlook is any more bullish.
Conversely, it remains bearish because of multiple developments that happened before the current pause. For instance, the invalidation of gold’s breakout above its 2011 high. Even though it had help from a sliding USD Index, the yellow metal still failed to hold above this critical support level.
It seems that the only thing that made gold rally in the recent past was the U.S. inauguration-based uncertainty. As it fades away, gold is losing its gleam. In fact, the previous relative weakness seems to have already returned.
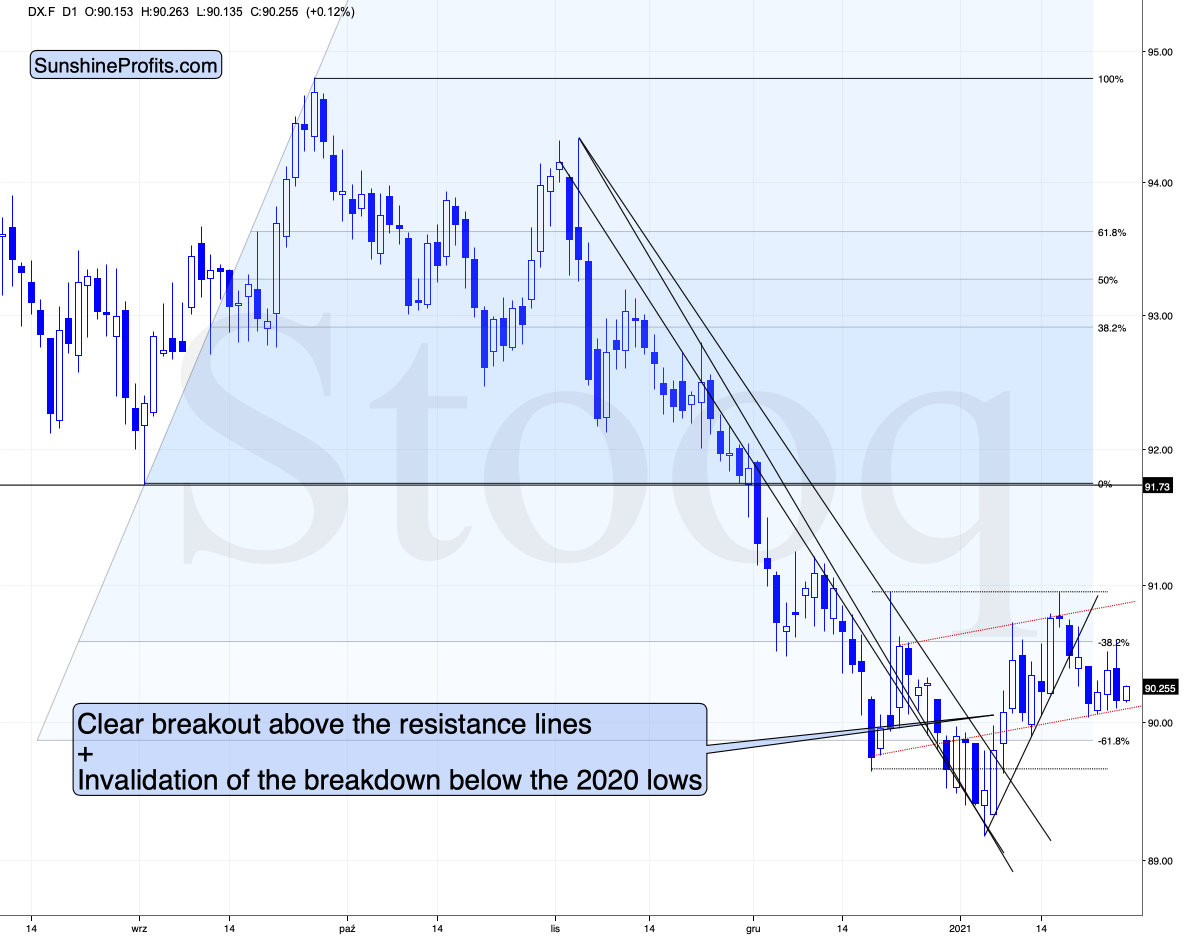
Figure 1 – USD Index futures (DX.F)
Taking the previous two days into account (precisely: yesterday and today’s pre-market trading), we see that the USD Index declined. In such a situation, gold should have rallied or at least paused, but what did it do?
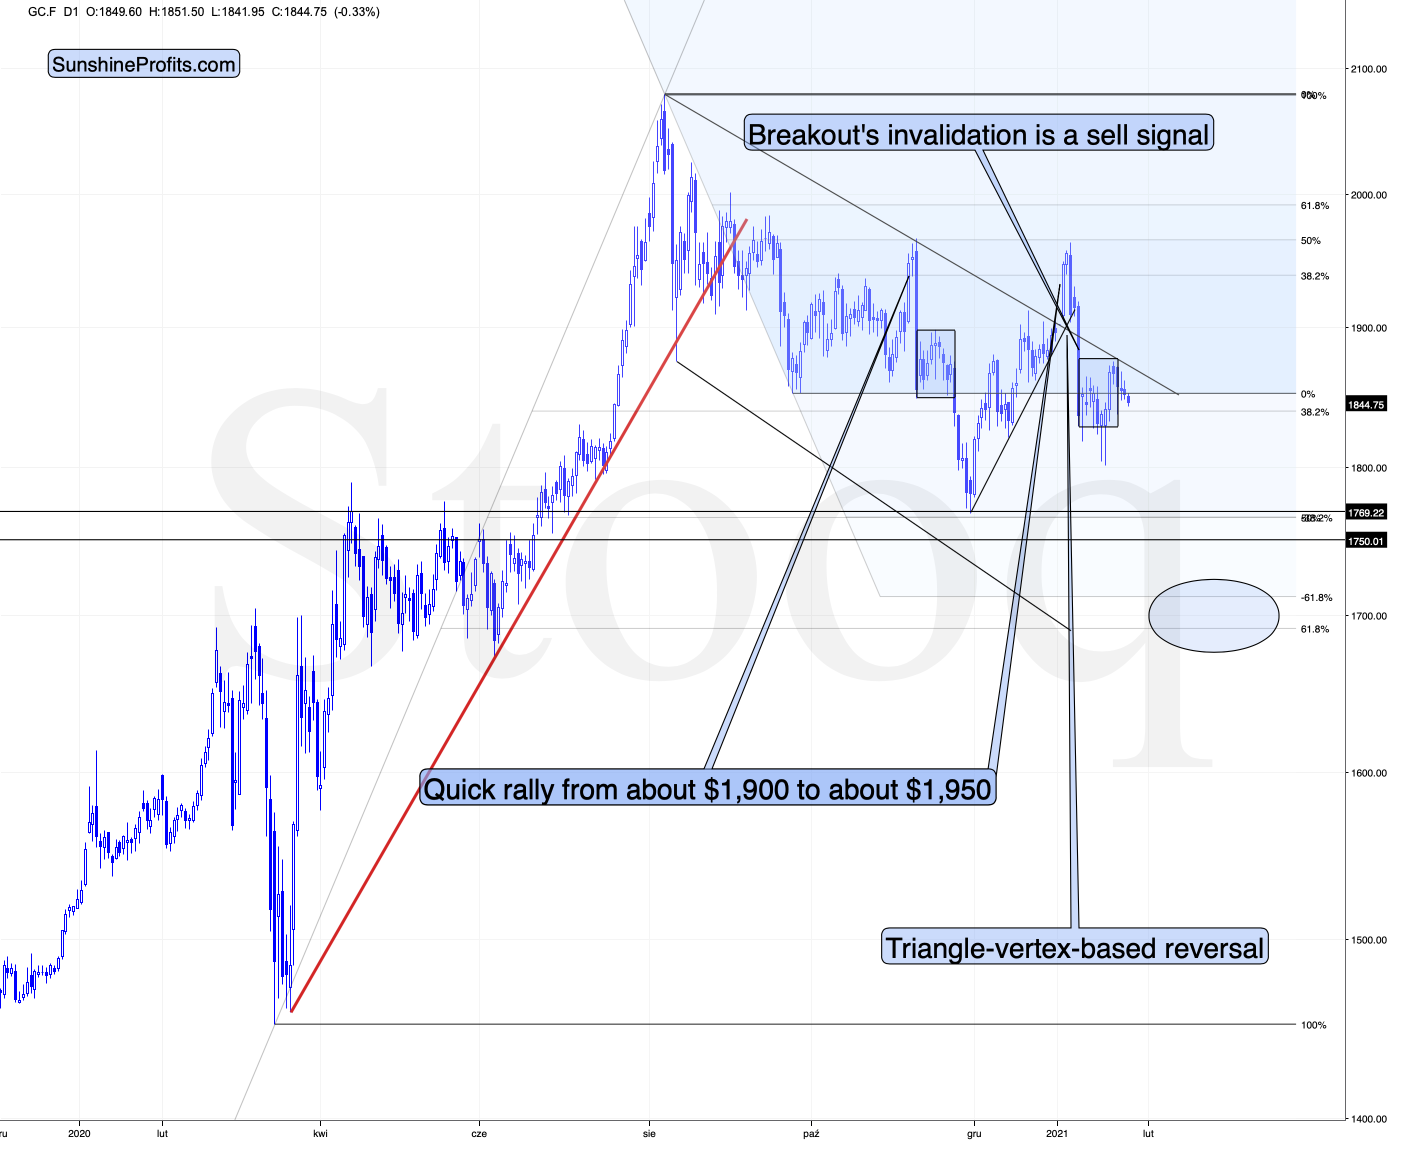
Figure 2 - COMEX Gold Futures (GC.F)
Gold declined. This means that gold’s weakness relative to the USDX is back.
Looking at the above chart, I marked the November consolidation with a blue rectangle, and I copied it to the current situation, based on the end of the huge daily downswing. Gold moved briefly below it in recent days, after which it rallied back up, and right now it’s very close to the upper right corner of the rectangle.
This means that the current situation remains very similar to what we saw back in November, right before another slide started – and this second slide was bigger than the first one. Consequently, there’s a good reason for gold to reverse any day (or hour) now.
Let’s get back to the USD Index for a minute.
I think that the USD Index is likely to rally in the following weeks, but as far as the next several days are concerned, the situation is relatively unclear.
The USD Index finds itself after the breakout above the declining medium-term resistance line, but it’s also after a breakdown below the rising short-term support line. Consequently, it’s very short-term outlook is relatively unclear. In all cases, I don’t see it moving visibly below the previous 2021 low.
And since the situation is unclear with regard to the short-term in case of the USDX, it would be natural for gold to hesitate. Since it’s already declining, it seems that even if the USDX tested its previous 2021 low, gold would not rally far.
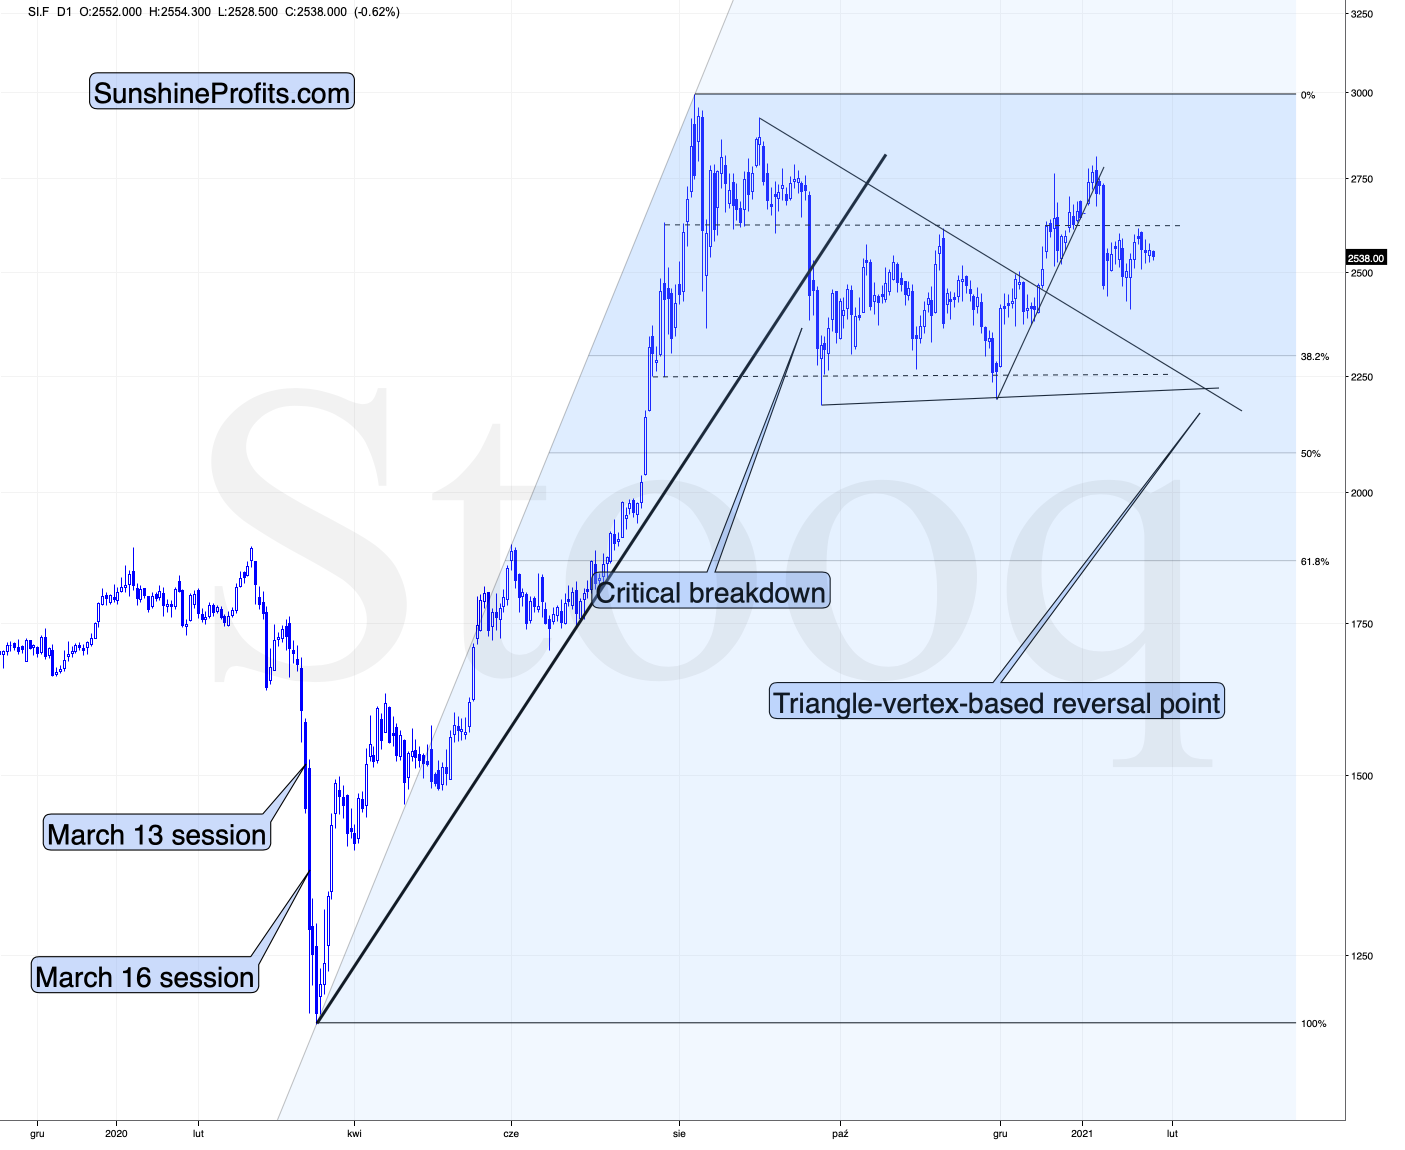
Figure 3 - COMEX Silver Futures (SI.F)
Similarly to gold, silver is not doing much. The white metal is moving back and forth after the big January slide and it seems to be preparing for another move lower.
Let’s keep in mind that silver has a triangle-vertex-based reversal in late February – close to Feb. 23. Based on what we’ve seen so far, it seems quite likely that it will be a major bottom (not likely the final one for this slide, though).
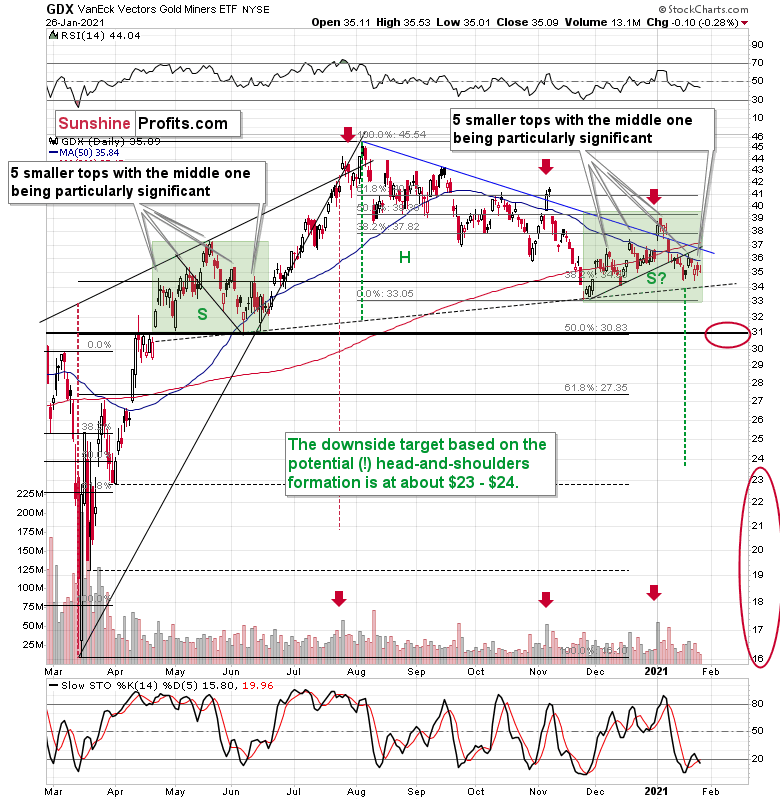
Figure 4 - VanEck Vectors Gold Miners ETF (GDX)
Miners didn’t do much yesterday either, so my previous comments on them remain up-to-date. To explain the pattern, I wrote on Jan. 11 :
If you analyze the chart above, the area on the left (marked S) represents the first shoulder, while the area in the middle (H) represents the head and the area on the right (second S) represents the potential second shoulder.
Right now, $33.7-$34 is the do-or-die area. If the GDX breaks below this (where the right shoulder forms) it could trigger a decline back to the $24 to $23 range (measured by the spread between the head and the neckline; marked with green).
And after analyzing Thursday’s (Jan. 21) price action, I wrote the following (on Jan. 22):
As far as the miners are concerned, mining stocks didn’t correct half of their 2021 decline. They didn’t invalidate the breakdown below the rising support line, either. In fact, the GDX ETF closed yesterday’s session below the 50-day moving average. Technically, nothing changed.
Regarding the GDX ETF’s current consolidation pattern (November to present), it mirrors what we saw between April and June of last year (the shaded green rectangles above).
I added:
Both shoulders of the head-and-shoulder formation can be identical, but they don’t have to be , so it’s not that the current consolidation has to end at the right border of the current rectangle. However, the fact that the price is already close to this right border tells us that it would be very normal for the consolidation to end any day now – most likely before the end of January.
If we see a rally to $37, or even $38, it won’t change much – the outlook will remain intact anyway, and the right shoulder of the potential head-and-shoulders formation will remain similar to the left shoulder.
But with many paths to get there, is hitting $37 or $38 a prerequisite to the eventual decline? Absolutely not. The GDX ETF could reverse right away and catch many market participants flat-footed.
Remember, it’s important to keep last week’s rally in context. Despite the Yellen-driven bounce, the GDX ETF is still down considerably from its January highs.
Having said that, let’s take a look at the market from a more fundamental angle.
The Widening Economic Divergence
For weeks, I’ve been highlighting the economic malaise confronting the Eurozone. And like a fork in the road, the U.S. and Europe continue to head in opposite directions. More importantly though, the fundamental fate of the two regions, and the subsequent performance of the EUR/USD, will go a long way in determining the precious metals’ destiny.
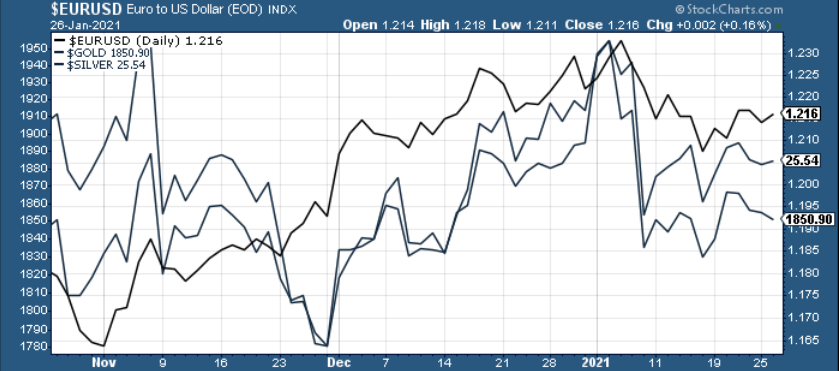
Figure 5
If you analyze the chart above, you can see that gold and silver tend to track the performance of the EUR/USD. And while gold bucked the trend on Tuesday (Jan. 26), silver still remains a loyal follower. Thus, as the European economy sinks further into quicksand, its relative underperformance is likely to pressure the EUR/USD and usher the PMs lower.
On Friday (Jan. 22), the IHS Markit Eurozone Composite PMI fell to 47.5 in January (down from 49.1 in December), with services falling to 45.0 (from 46.4) and manufacturing falling to 54.7 (from 55.2).
Please see below:
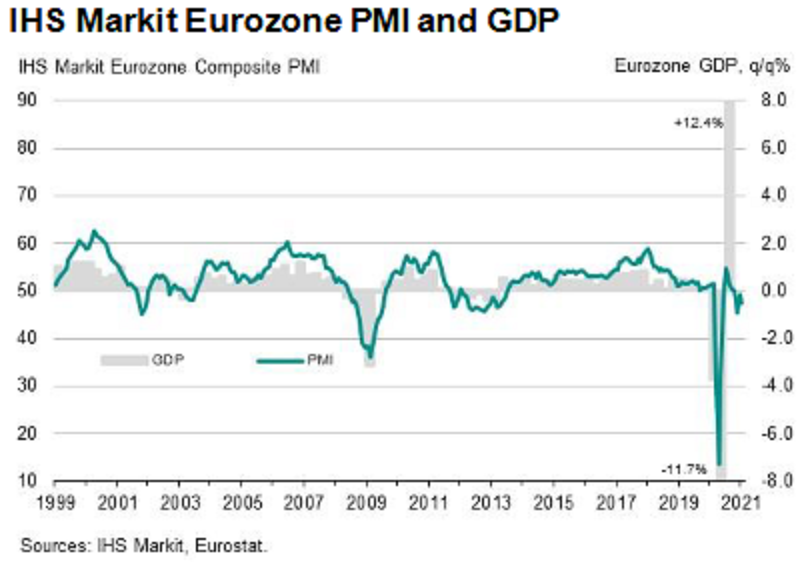
Figure 6
To explain, PMI (Purchasing Managers’ Index) data is compiled through a monthly survey of executives at more than 400 companies. A PMI above 50 indicates business conditions are expanding, while a PMI below 50 indicates that business conditions are contracting (the scale on the left side of the chart).
In contrast to the Eurozone, the U.S. Composite PMI rose to 58 in January (up from 55.3 in December), with services rising to 57.5 (up from 54.8) and manufacturing rising to 59.1 (up from 57.1).
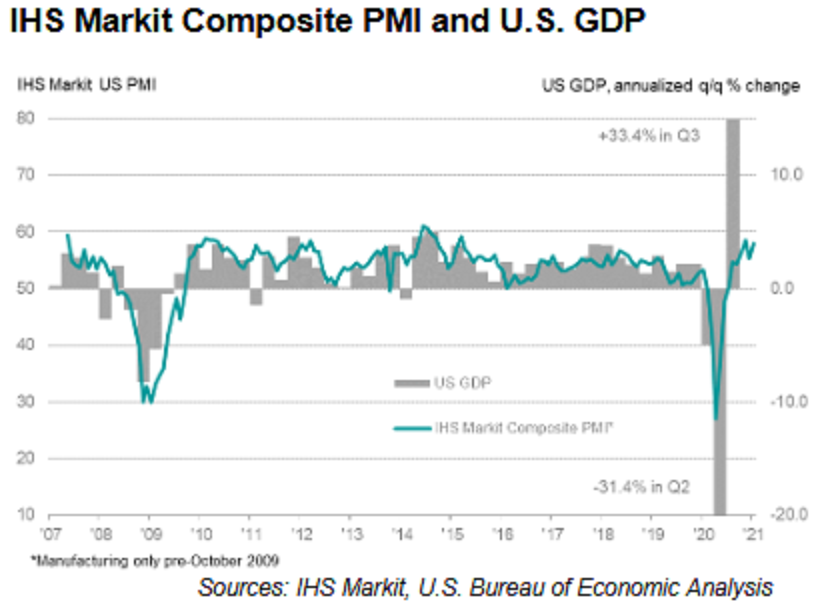
Figure 7
In addition, after European Central Bank (ECB) President Christine Lagarde revealed (on Jan. 21) that the Eurozone economy likely shrank in the fourth-quarter (all but sealing a double-dip recession), Germany (the Eurozone’s largest economy) cut its 2021 GDP growth forecast from 4.4% to 3.0%.
And not looking any better, the International Monetary Fund’s (IMF) World Economic Outlook Report – which covers IMF economists' analysis over the short and medium-term – has the U.S. economy expanding by 5.1% in 2021 versus only 4.2% for the Eurozone. More importantly though, the Eurozone economy is expected to contract by 7.2% in 2020 versus 3.4% for the U.S. As a result, Europe has to dig itself out of a much larger hole.
Please see below:
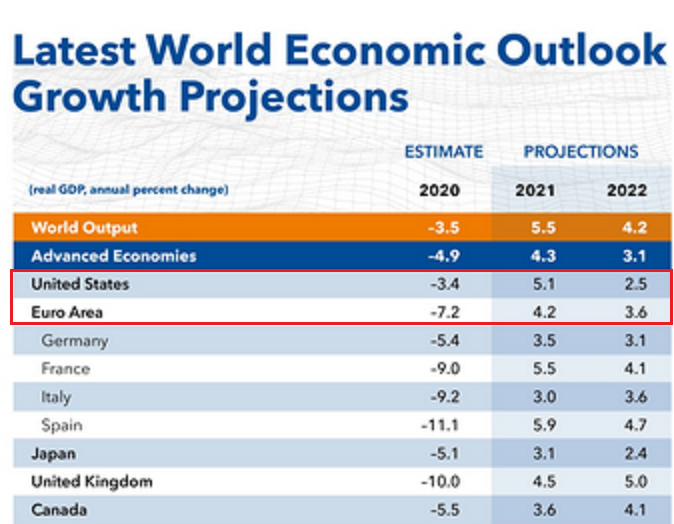
Figure 8
Also noteworthy, the IMF downgraded its GDP growth forecast for Canada. And because the USD/CAD accounts for more than 9% of the movement in the USD Index (though still well below the nearly 58% derived from the EUR/USD) it’s an important variable to monitor.
Continuing the theme of Eurozone underperformance, U.S. consumer confidence (released on Jan. 26) rose from 87.1 in December (revised) to 89.3 in January (the red box below).
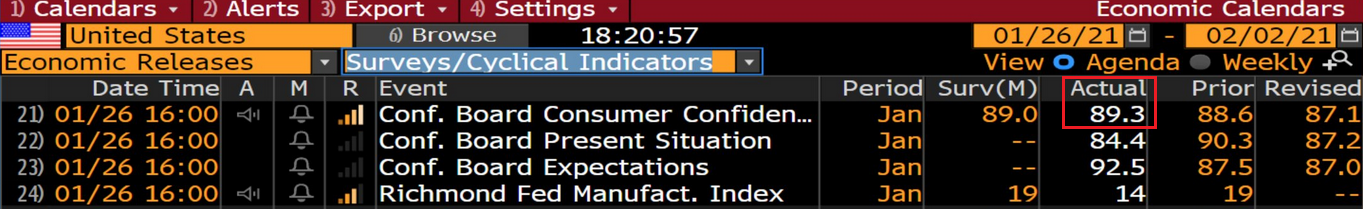
Figure 9 - Source: Bloomberg/ Daniel Lacalle
In contrast, Eurozone consumer confidence (released on Jan. 21) retreated in January. And while both regions’ readings are still well below pre-pandemic levels, currencies trade on a relative basis. As a result, the relative underperformance of the Eurozone is bearish for the EUR/USD.
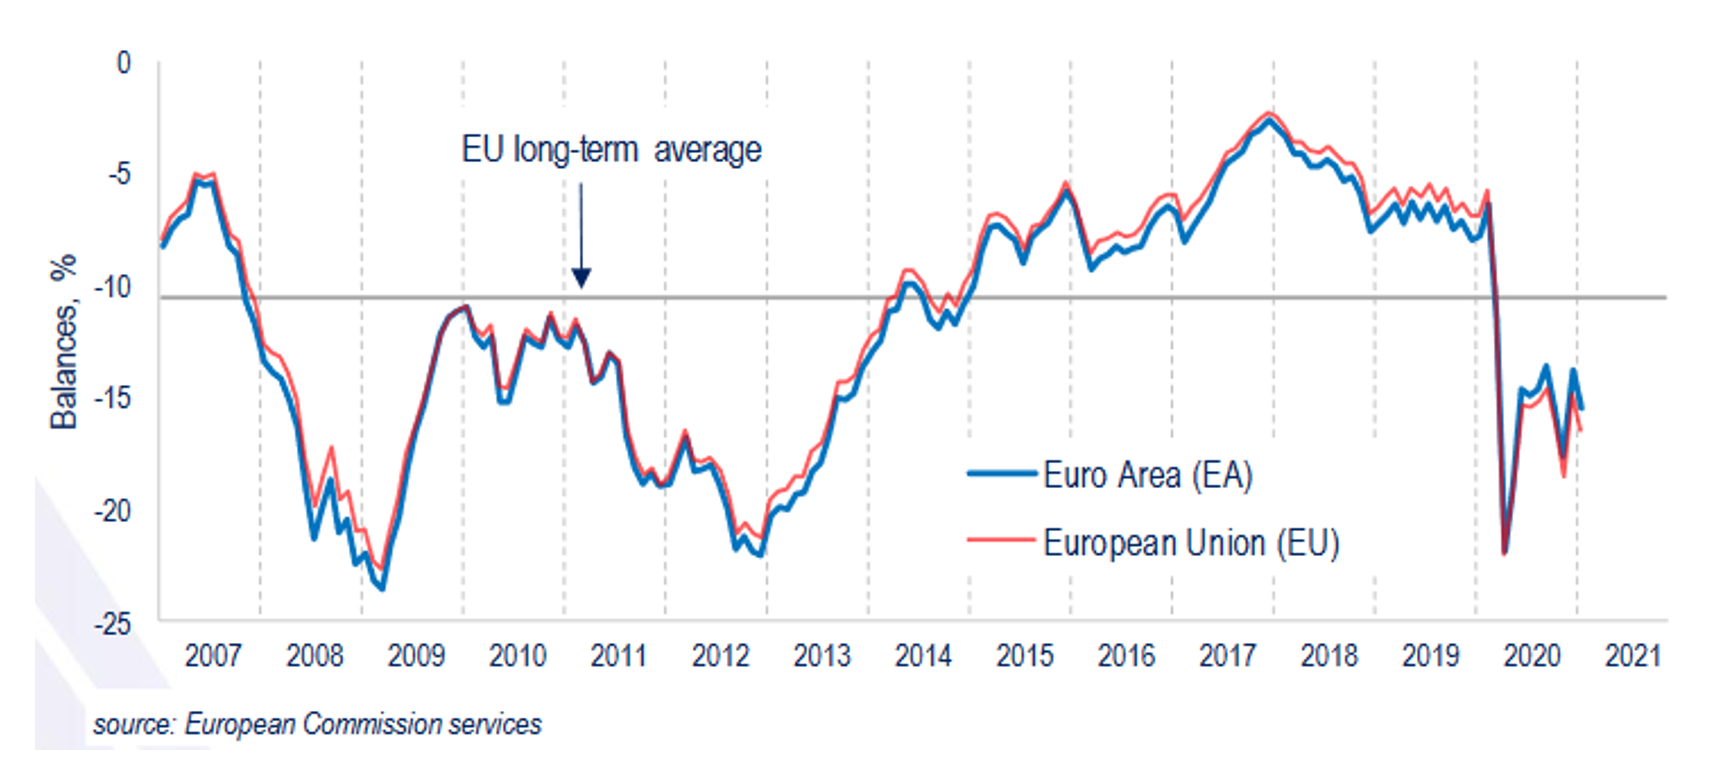
Figure 10
If that wasn’t enough, the ECB essentially admitted it wants a weaker euro. On Tuesday (Jan. 26), reports surfaced that the ECB will investigate the causes of the euro’s appreciation relative to the greenback. Translation? The central bank is studying ways to devalue the currency.
Adding more fuel to the fire, the yield differential between the U.S. and Europe foretells a higher USD Index. Dating back to 2003, after the U.S. 10-Year Treasury yield troughed and began rising, the USD Index (except for 2008-2009) always followed suit.
Please see below:
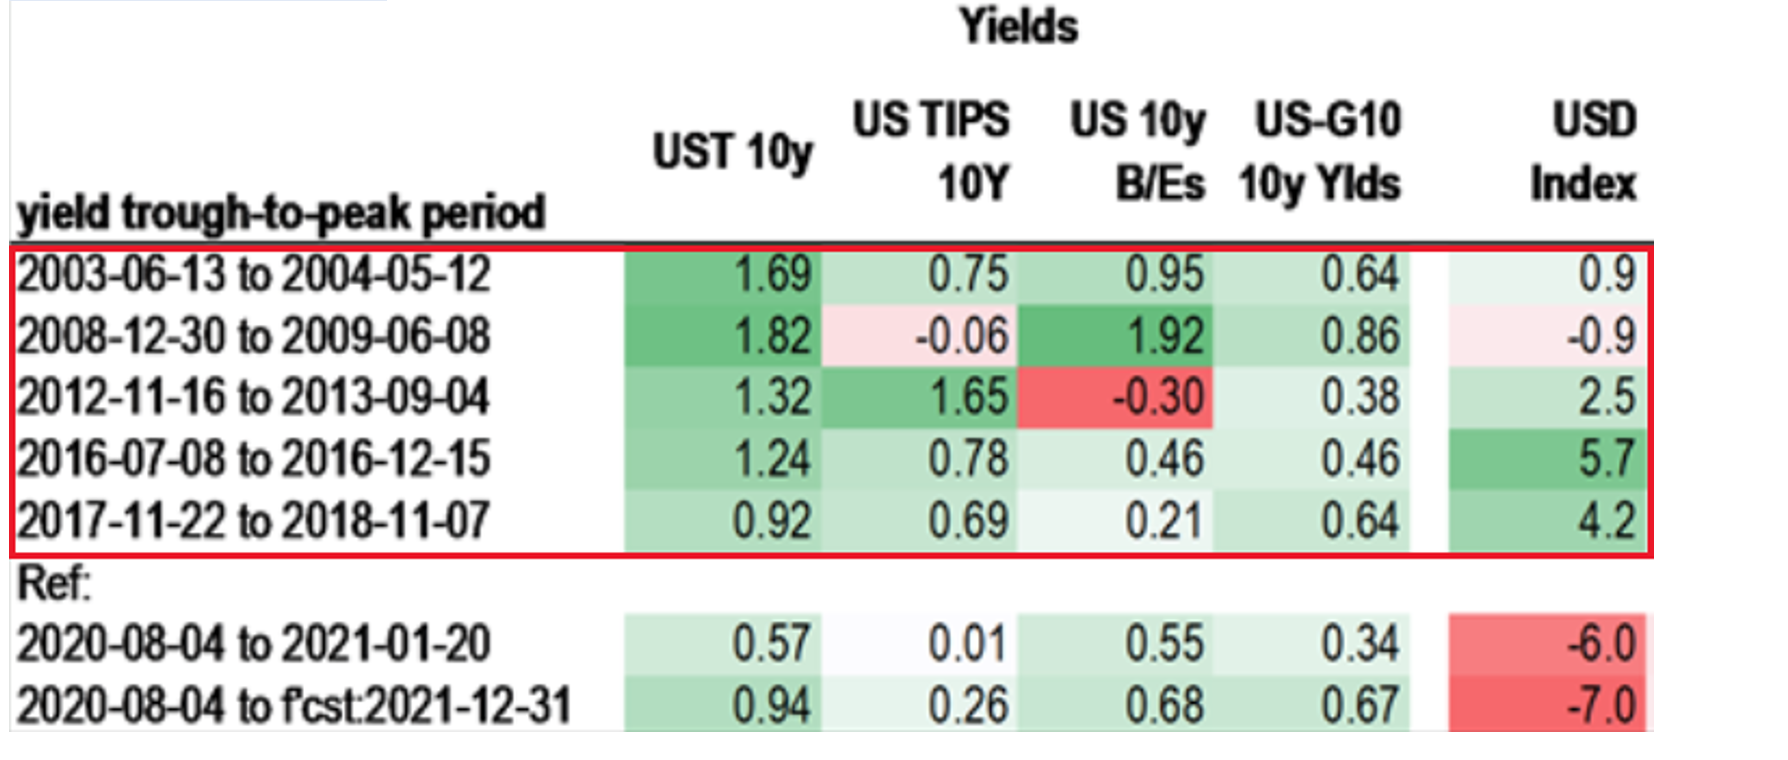
Figure 11 - Source: Daniel Lacalle
In contrast, if you analyze the area at the bottom, you can see that the U.S. 10-Year Treasury yield has bounced by 57 basis points from its August low. But moving in the opposite direction, the USD Index is lower now than it was it August.
Furthermore, notice the large divergence that’s occurred since the beginning of December?
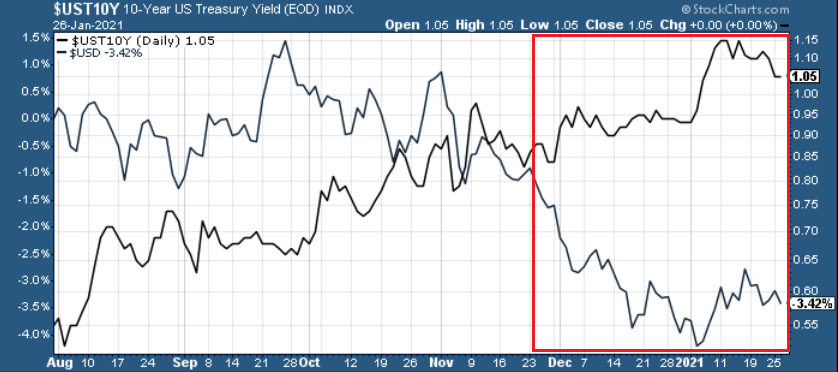
Figure 12
The abnormal behavior above highlights the power of sentiment. Because U.S. investors ‘want’ a lower USD Index, they’re willing to overlook technicals, fundamentals, historical precedent and essentially, reality. However, if the dynamic reverses, the USD Index is ripe for a resurgence.
Circling back to the euro, the currency is already starting to crack. On Monday (Jan. 25), I wrote that Janet Yellen’s pledge to “act big” on the next coronavirus relief package ushered the EUR/GBP back above critical support.
However, on Tuesday (Jan. 26), the key level broke again.
Please see below:

Figure 13
More importantly though, a break in the EUR/GBP could be an early warning sign of a forthcoming break in the EUR/USD.
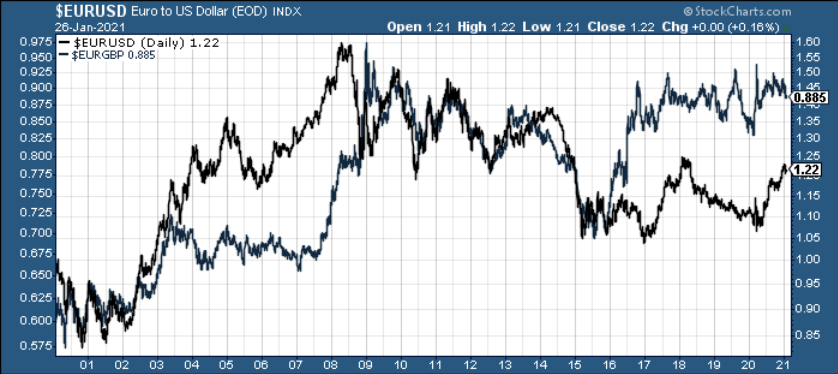
Figure 14
If you analyze the chart above, ~20 years of history shows that the EUR/GBP and the EUR/USD tend to follow in each other’s footsteps. As a result, if the EUR/GBP retests its April low (the next support level), the EUR/USD is likely to tag along for the ride (which implies a move back to ~1.08).
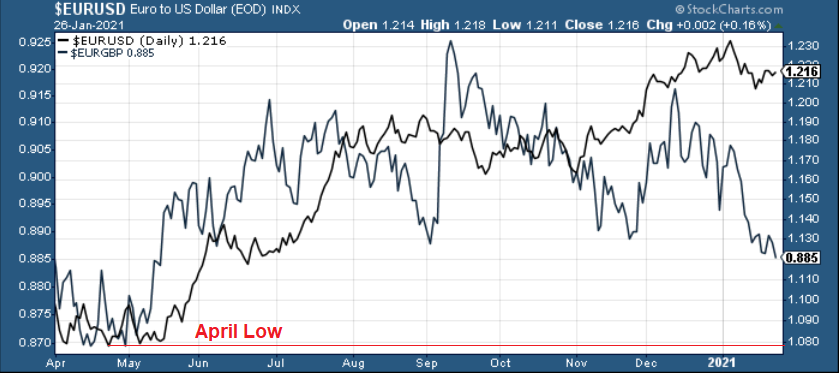
Figure 15
And like a falling string of dominoes, if the EUR/USD retests ~1.08, the PMs should come under significant pressure.
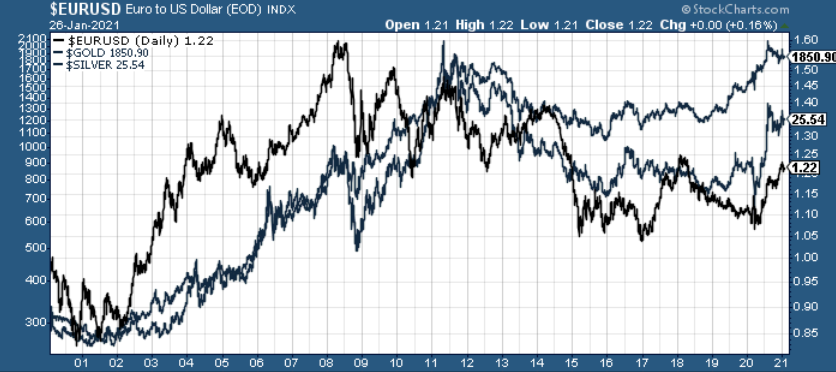
Figure 16
If you analyze the chart above, you can see that over the last ~20 years, gold and silver tend to live and die with the EUR/USD. Naturally, there are also other factors, but the point is that the performance of this currency pair shouldn’t be ignored. As a result, a euro collapse (or at least a significant decline in it) could deliver plenty of fireworks. Conversely, once order is restored and weak Eurozone fundamentals are accurately priced into the EUR/USD, the precious metals will present us with an attractive buying opportunity.
Thank you for reading our free analysis today. Please note that the above is just a small fraction of today’s all-encompassing Gold & Silver Trading Alert. The latter includes multiple premium details such as the targets for gold and mining stocks that could be reached in the next few weeks. If you’d like to read those premium details, we have good news for you. As soon as you sign up for our free gold newsletter, you’ll get a free 7-day no-obligation trial access to our premium Gold & Silver Trading Alerts. It’s really free – sign up today.