
Trending

Written by: Przemyslaw Radomski, CFA
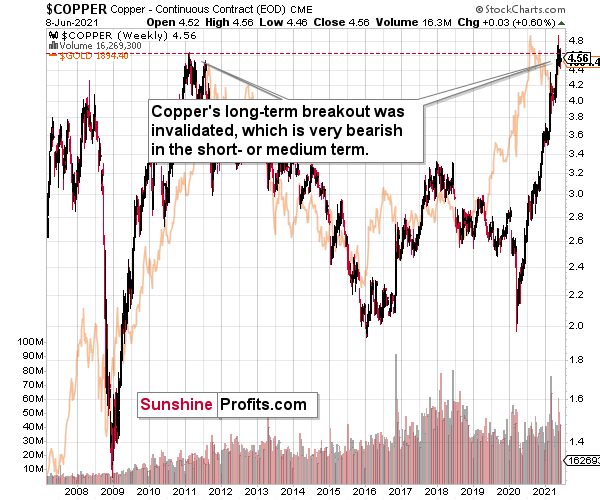
Copper is often overlooked when looking for gold price movement clues. But this time, its breakout invalidation may have the high ground.
Do you know what the key commodity in today’s world is? Crude oil. It’s the most commonly used good on the planet. In terms of versatility and number of applications, silver is not far behind, but there is also one more market that definitely comes to one’s mind when one hears “world commodity” – copper. And for a good reason – while it doesn’t have as unique properties as silver or gold, copper is much cheaper and thus more widely available.
Consequently, what’s happening in copper prices might have quite profound effects on the rest of the world, including the precious metals market. And the thing is: something very important happened to the price of copper recently.
The Importance of the Brown Metal
Namely, copper has just invalidated its breakout to new highs, which means that – just like in the case of gold in August 2020 – it wasn’t strong enough to soar higher. Well, it’s not to say that copper is weak, as it has more than doubled its price since the 2020 lows. However, it does mean that it’s likely time for a bigger corrective downswing, especially given that we haven’t seen one in many months. For instance, when gold invalidated its breakout above the 2011 high despite very bullish fundamentals, it meant that forecasting gold at lower levels was very much justified.
Likewise, when copper failed to hold its breakout above the 2008 high back in 2011, it was followed by a multi-year decline. Will the same happen this time? I wouldn’t bet on that given the amount of money being pumped into the system, but even if this is not the case, copper is likely to suffer a significant drawdown on a temporary basis. No market can move up or down in a straight line, and neither copper nor gold nor silver are exceptions to this rule.
Ok, but why is it important for the precious metals investors?
Because of two things:
- Both markets tend to move in a big way at similar times. The more local moves can vary, but the really big price moves are usually aligned. For example, the 2008 – 2011 rally and the fact that they both bottomed in late-2015 / early-2016.
- The copper price is quite closely related to the general stock market and the former’s inability to hold above its previous highs seems to be an indication of a change in the trend in the general stock market as well.
As I wrote before, the general stock market’s decline is not required for the precious metals sector to decline, but it would likely exacerbate the decline, just like it did in 2008 – especially in the case of silver and mining stocks.
And speaking of stocks, let’s check what the S&P 500 is doing.
The markets are self-similar (which is another way of saying that they have a fractal nature), which generally means that while the history tends to rhyme, it also tends to rhyme in similar shapes of alike or various sizes.
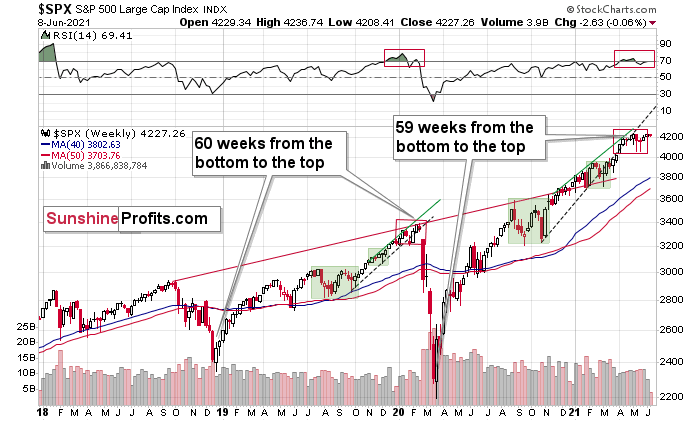
For example, the rally from 2018–2020 seems very similar to the rally from 2020 to the present. Both rallies started after a sharp decline, and the first notable correction took the form of back-and-forth trading around the previous high. I marked those situations with big rectangles.
Then the rally continued with relatively small week-to-week volatility. I created rising support lines based on the final low of the broad short-term consolidation and the first notable short-term bottom.
This line was broken, and some back-and-forth trading followed, but it was only about half of the previous correction in terms of price and time.
Then, we saw a sharp rally that then leveled off. And that was the top . The thing that confirmed the top was the visible breakdown below the rising support line right after stocks invalidated a tiny breakout to new highs. That’s what happened in February 2020, and that’s what seems to be taking place right now.
Back in 2020, the rally ended when the weekly RSI moved above 70 once again and when the S&P moved slightly to its new highs. While the history doesn’t have to repeat itself to the letter, if we see another small move higher – to new highs – that also takes the RSI above 70, please keep in mind that it’s not really a bullish development, but actually history forming its final rhyme. And the implications appear bearish for the precious metals sector, as it’s likely to be hit by the first wave of stock market declines – just like it was the case in 2008, 2020, and… 1929.
Moreover, mining stocks’ performance relative to hold has been heralding the declines across the precious metals market for some time now.
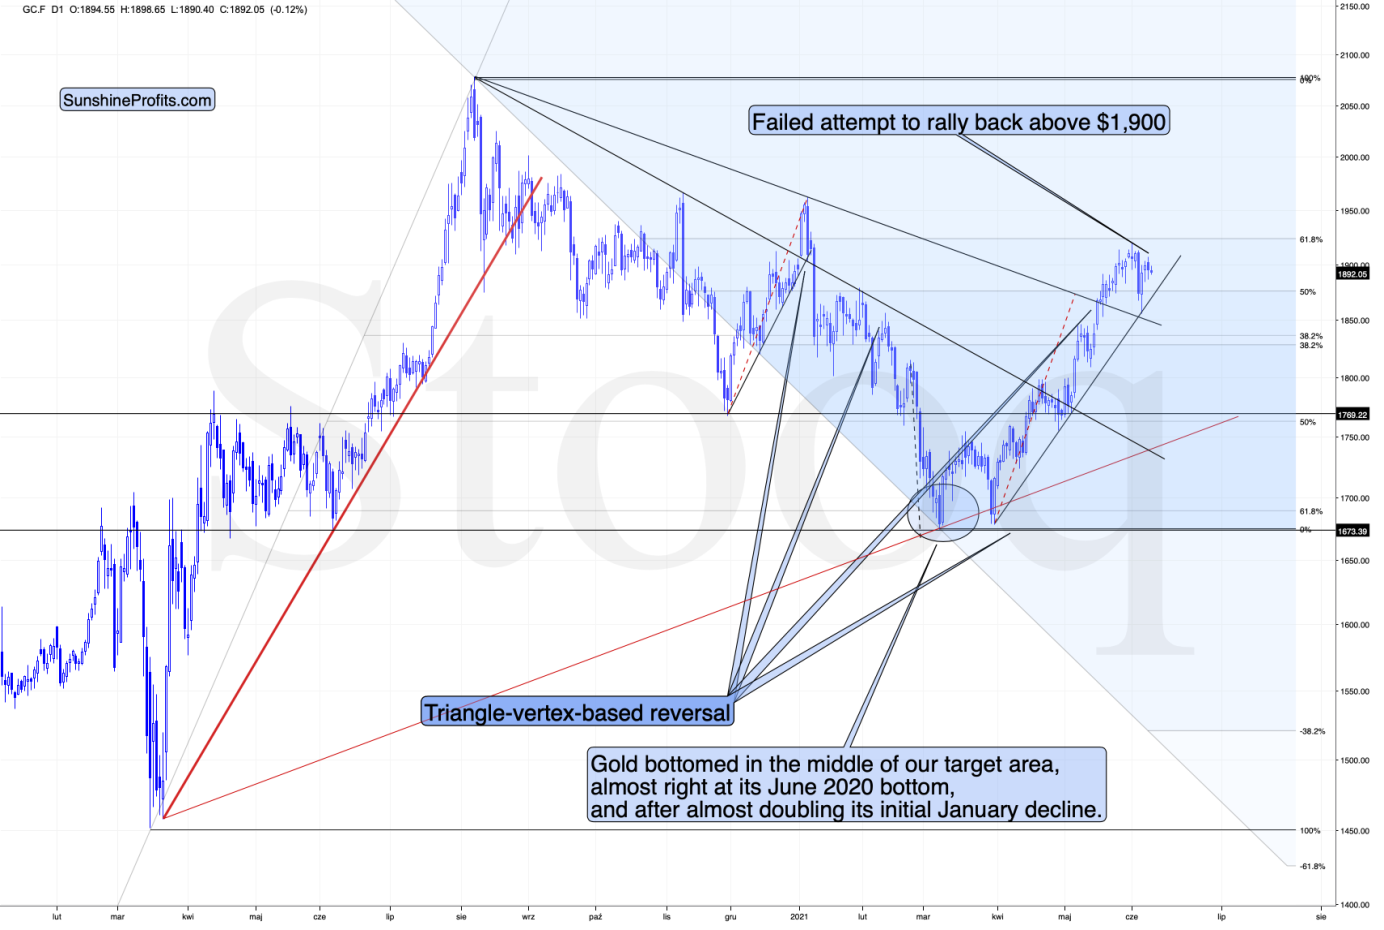
While gold is not doing much today, it’s important to note that yesterday it moved quite close to its previous highs (and visibly above $1,900) before declining. And how did gold miners react?
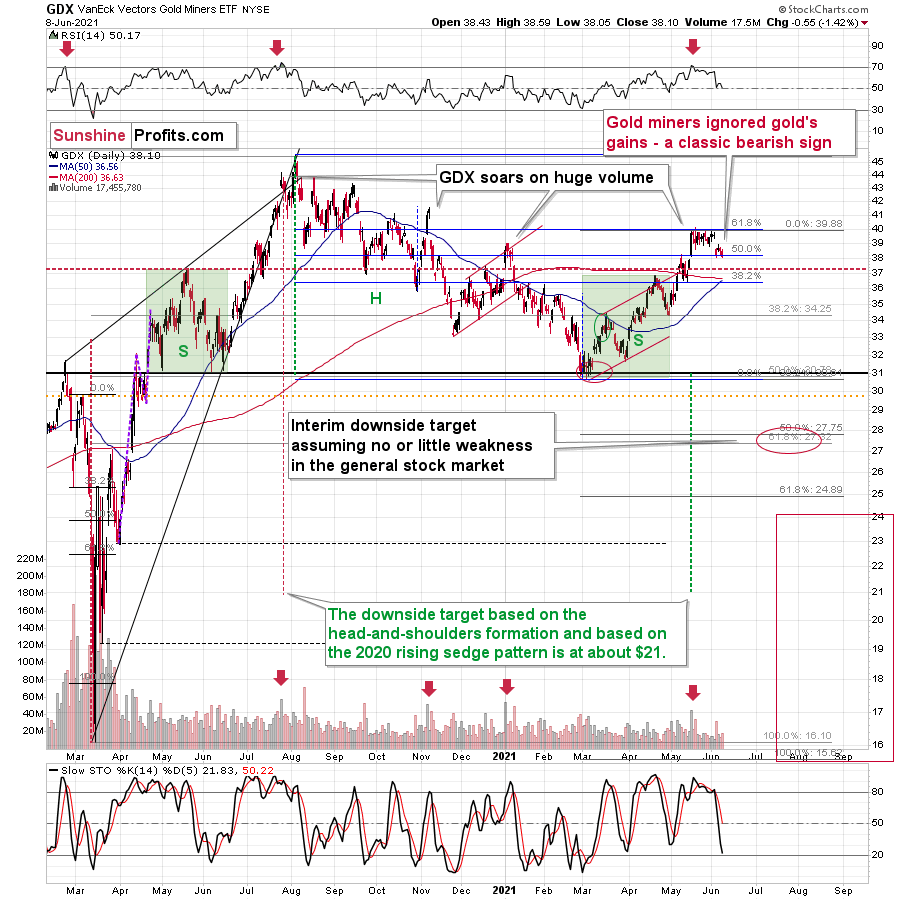
In short, they didn’t. And the GDX ETF has just closed at a new monthly low.
Even without considering the invalidation of the breakout to new highs, the sell signal from the RSI and stochastic indicators, and even without noticing that the GDX corrected to its 61.8% Fibonacci retracement without invalidating it, one can clearly see that gold stocks refused to follow gold higher during the most recent rebound. This is bearish – and quite profoundly so.
Related: US Government Stimulus Went Wrong. How Will Gold React?
The views and opinions expressed in this article are those of the contributor, and do not represent the views of IRIS Media Works and Advisorpedia. Readers should not consider statements made by the contributor as formal recommendations and should consult their financial advisor before making any investment decisions. To read our full disclosure, please click here.