It seems like we just wrote a piece of this type, and it turns out we had. Two weeks ago we examined options pricing ahead of Tesla’s (TSLA) robotaxi announcement, noting that the market was treating it much like an earnings report. Considering that the stock fell nearly 9% after that event, the TSLA faithful are hoping for a better result after today’s close.
Based upon its performance so far this year, TSLA has not just justified its inclusion as part of the so-called “Magnificent Seven”. It is about -13% lower on a year-to-date basis. The other six stocks are all higher, with Microsoft’s (MSFT) +15% offering the weakest performance of the rest. (For the record, in January we advocated replacing TSLA with Broadcom (AVGO) in the Mag 7. The latter stock is up about 60% ytd.)
We recently noted that the stock’s performance can be divided into two phases: BT (Before Twitter) and AX (After X). If we choose the deal’s closing date as a start date, the stock’s performance has been lackluster at best (down about -3%). If we start from the deal’s announcement date, the performance has been downright lousy (down about -33%). It is no wonder that the mentality surrounding TSLA earnings has changed. Just ahead of its report in January we noted that there was little risk aversion priced into the options. Since then, that hasn’t been the case – including today.
For starters, the IBKR Probability Lab for TSLA options expiring this Friday shows a peak in the $207.5-$212.5 range, a bit below the current $215.36:
IBKR Probability Lab for TSLA Options Expiring October 25th, 2024

Source: Interactive Brokers
Interestingly, at money weekly options are pricing in a roughly 7.5% post earnings move. That seems low, considering that the past seven TSLA earnings reports resulted in either double digit percentage moves or something just shy (-12.33%, +12.06%, -12.13%, -9.3%, -9.74%, -9.75%, +10.97%). It is also sobering to note that only one of the last six, and two of the last seven reports have resulted in upward moves.
Skews for TSLA Options Expiring October 25th (dark blue), November 1st (light blue), and November 15th (yellow)

Source: Interactive Brokers
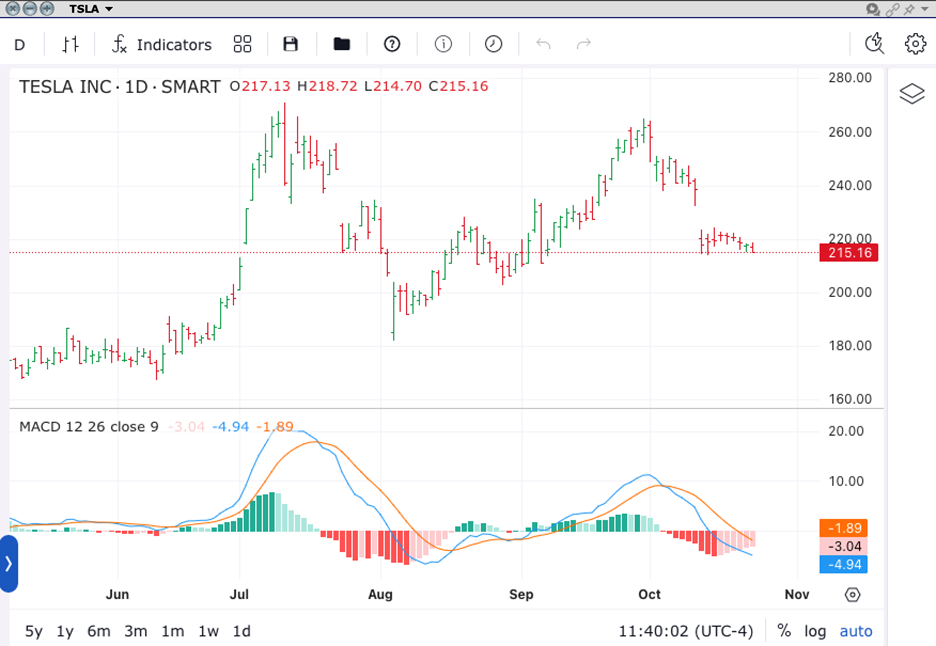
There is a bit of an odd W shape to the skew of this week’s options, with a bit of an implied volatility bump for at-money options compared to those just out-of-the-money in both directions. The downside skew for that expiry is very pronounced, however. It seems to reflect a concern that a break below current levels could be significant, as the chart below (using the new advanced TWS charting feature) shows:
TSLA, 6-Months Daily Candles (top) with MACD (12,26,9, bottom)

There is an important feature to keep in mind. Options pricing can often be a contrarian indicator. If everyone is nervous, then the result can be benign, and vice versa. Today’s setup into TSLA earnings somehow simultaneously shows a bit of concern (probability, skews) and a relative lack thereof (at-money volatility). We’ll learn who is correct soon enough.
Related:


