After Friday’s close we learned the latest changes to the Nasdaq 100 Index (NDX). Illumina (ILMN), Moderna (MRNA), and Super Micro Computer (SMCI) are being replaced by Axon Enterprise (AXON), Palantir Technologies (PLTR), and MicroStrategy (MSTR) effective prior to next week’s open. That promises to bring some excitement on Friday afternoon’s close, but also in the weeks to come.
The new additions, particularly MSTR, have the potential to ramp up NDX’ volatility for quite some time. Bitcoin tends to be highly correlated with NDX (R-squared of .84 over the past two years weekly data) though with a higher beta (6.7 over that same period), and MSTR, by its nature, is a turbocharged play on bitcoin. For better or worse, anyone who buys a fund like QQQ will be placing an implicit bet on bitcoin and a leveraged means of gaining exposure to it.
This type of rebalancing is quite normal. Index typically seek to replace the lowest weighted stocks with more highly capitalized ones. While that mentality is completely rational – the goal of a flagship, market-capitalization-weighted index is to represent the key stocks in its purview – it can force the funds that track the index to buy high and sell low. We might remember MRNA as a covid-era darling. The keepers of NDX did their index a favor when they added MRNA to the index on July 20, 2020, but it has been a drag since peaking in 2021.
MRNA, 5 Years, with NDX Index Addition (red)

Source: Interactive Brokers
To be fair, that was a prescient case of picking a stock that was already on the rise and enjoying its move higher. That was not at all applicable to SMCI. The stock was added to NDX on July 22nd, meaning that it will have spent less than five months as an index component. At least it joined the index after it had already established an all-time high a few months prior.
SMCI, 1 Year, with NDX Index Addition (red)

Source: Interactive Brokers
Anyone who has been paying attention to markets should be aware of MSTR’s recent rocket-ship ride. As most of us know, this company, while ostensibly an application software provider, has essentially been operating as a bitcoin holding company for quite some time. In recent weeks it has far outperformed the increase in value of its crypto holdings. Some of that is the nature of its operations. They issue convertible debt and new shares and use the proceeds to buy more bitcoin, effectively turning into a leveraged play on the price of bitcoin. We can see how it has outperformed both its new index and the price of bitcoin in recent weeks.
MSTR, 1 Year

Source: Interactive Brokers
MSTR, 5 Years

Source: Interactive Brokers
But the “buy high, sell low” aspect of index rebalancing becomes quite clear when we compare MSTR to SMCI over the past six months. Indeed, there are reasons for the divergent performance – MSTR’s ties to zooming crypto prices versus questions about SMCI’s accounting – but strictly from a performance basis over SMCI’s short tenure in NDX, the index will be forced to buy one stock after a parabolic upward move and sell another that has fallen by more than 50% since it was added:
6-Months, MSTR (white), SMCI (purple)

Source: Interactive Brokers
And that brings us to question how this will impact NDX volatility over the coming weeks. Quite frankly, the index is adding a highly volatile stock in MSTR. While its 30-day historical volatility is less than SMCI’s, its implied volatility is quite similar. But the incoming MSTR will be far more heavily weighted than the outgoing SMCI. The latter has a tiny index weight as one of the smallest companies in NDX; the former’s ~$100bn market cap will put it in the top third, somewhere near Starbucks (SBUX).
MSTR Implied Volatility (white), 30-day Historical Volatility (orange), 2-month period

Source: Interactive Brokers
SMCI Implied Volatility (white), 30-day Historical Volatility (orange), 2-month period

Source: Interactive Brokers
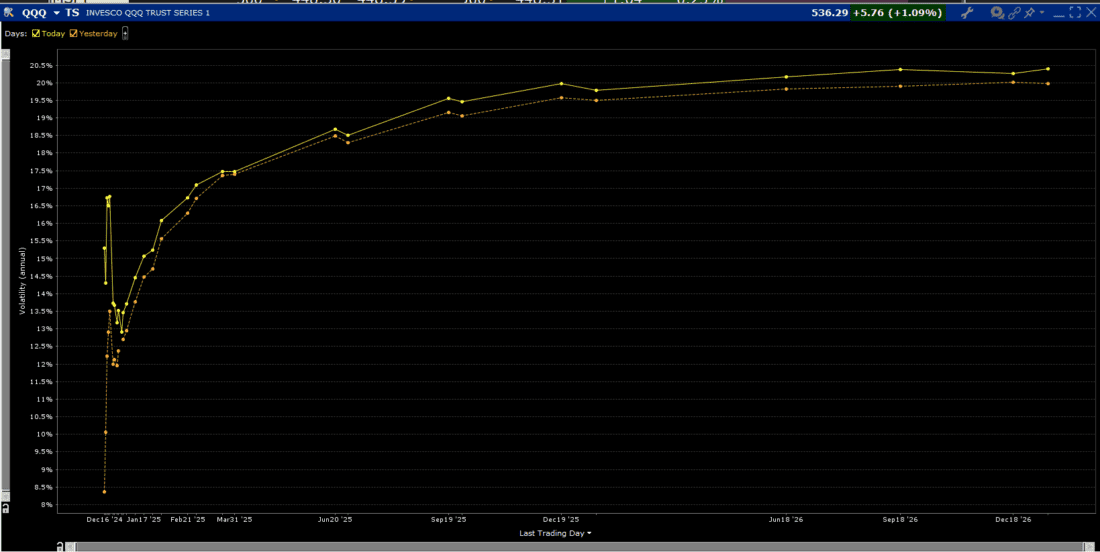
This has in turn caused the market’s volatility assumptions for NDX volatility to shift higher after the index addition. Note the roughly parallel shift higher for QQQ’s implied volatility curve between today and Friday (we use the Invesco QQQ ETF as a proxy for NDX because of its greater liquidity than NDX index options):
QQQ Volatility Term Structure

Source: Interactive Brokers
One new addition does not change the thesis for whether investors should maintain their exposure to a 100-stock index. But the addition of MSTR changes the volatility profile of NDX noticeably. That is quite a bit of influence for a new adoptee.
(For reference, the implied and historical volatilities of the other NDX additions and deletions follow)
PLTR Implied Volatility (white), 30-day Historical Volatility (orange), 2-month period

Source: Interactive Brokers
MRNA Implied Volatility (white), 30-day Historical Volatility (orange), 2-month period

Source: Interactive Brokers
AXON Implied Volatility (white), 30-day Historical Volatility (orange), 2-month period

Source: Interactive Brokers
ILMN Implied Volatility (white), 30-day Historical Volatility (orange), 2-month period

Source: Interactive Brokers
Related: The Juan Soto Stock Market
