US equity markets were cruising along late last week, biding their time at modestly higher levels, and positioning themselves for yet another Friday afternoon rally fueled by expiring weekly options. Then we received an unpleasant surprise from Ann Arbor on Friday at 10am EDT.
We’re of course referring to the University of Michigan reports, and frankly they stunk. According to the results, consumers are less confident both about the economy and the inflation picture. The headline Sentiment number for May was 67.4, far, far below April’s 77.2 and the marginal decline to 76.2 that was expected. Current Conditions and Expectations were similar misses. (68.8 vs. 79.0 for the former; 66.5 vs. 75.0 for the latter).
But then there was a double-whammy from the inflation side. Both the 1-Year and 5-10-Year Inflationary Expectations were above expectations too. The 1-Year expectation is for 3.5% inflation, where 3.2% was last month’s result and the consensus; the 5-10-Year was 3.1% vs. 3.0% for last month and the consensus.
It’s relatively easy to dismiss the longer-term expectation as noise. If teams of economists routinely miss their own long-term expectations it seems unfair to burden ourselves with randomly sampled individuals. But inflationary expectations can’t be dismissed overall. They are a key factor in determining interest rates and play an explicit role in the Federal Reserve’s decision-making.
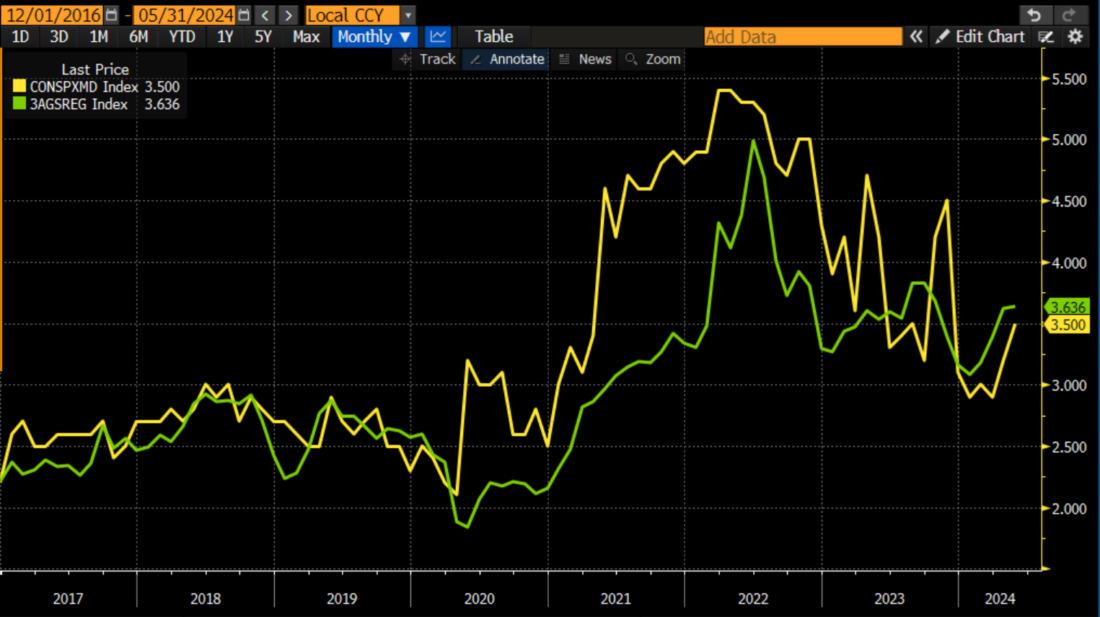
Yet we should be wary about how much faith we place on the Michigan Inflation Expectations. It’s clear that there are two factors that mitigate their effectiveness. When we graph the 1-Year Expectations against the price of unleaded regular gasoline, we see that the expectations have been following pump prices with a bit of a lag.
University of Michigan 1-Year Inflation Expectations (yellow) vs. Unleaded Regular Gasoline Prices (green)

Source: Bloomberg
One could argue that this reading’s upswing was simply the usual delayed reaction to rising gasoline prices.
Another thing to consider is that the 1-Year Expectations simply reflect current conditions rather than offer much in the way of prediction. This becomes more evident when we graph them against the one year change in the Consumer Price Index (CPI):
University of Michigan 1-Year Inflation Expectations (yellow) vs. Year-over-year Change in CPI (orange)

Source: Bloomberg
When we put the inflation expectations into that perspective, it’s understandable why markets are not performing worse. To be sure, the bond market is not loving these statistics, since yields are higher across the curve (the inflation worries appear to outweigh the poor economic implications), but stocks are only mixed at worst. UMich is known for hosting good parties, and equity investors seem unwilling to give up on the idea of one continuing today.


