Written by: Rafael Zorabedian
It’s the week of the Independence Day Holiday, and that typically leads to lighter volume trade. There is little in the way of economic data this week, so let’s find some potential opportunities.
Last week’s Non-Farm Payroll data was a refreshing change of pace for market participants. As the market expected 700K jobs added during June, the market got a print of 850K. The S&P 500 moved higher on Friday, tacking on about 25 handles from the time the data was released, and the close.
It was one of those Fridays where the market was up off of economic data and just kept drifting higher. The pre-holiday trade factored in here too, and volumes seem to dry up in the afternoon. On days like that, you would have to find a very compelling reason to get long or short anything. Most professionals are closing up their books ahead of the long weekend and just wanting to be flat. Over a period of years, I came to learn that Fridays were my least productive trading days, so I personally look to be flat, and/or have only longer-term swing trades or position trades on heading into a weekend.
That is useful insight, but it is so last week. What can we find this week?
First, I want to mention that this week is a light one on the economic data front. On Tuesday, we get the ISM Services PMI (manufacturing expansion or contraction). On Wednesday, we get the FOMC meeting minutes, which could provide some additional depth to the last Fed statement. We expect a light volume, holiday-week style trading week on the major exchanges this week.
Tropical Storm Elsa
We also have Elsa - currently a Tropical Storm (and will hopefully stay that way). Trade themes tend to center around energy, insurers, orange juice during Florida storms. I am currently writing to you from the projected path of Elsa, and hopefully, it will be weaker than expected! Personally, I would be looking to fade Elsa. I somewhat kid, but did you know that you can actually trade weather?
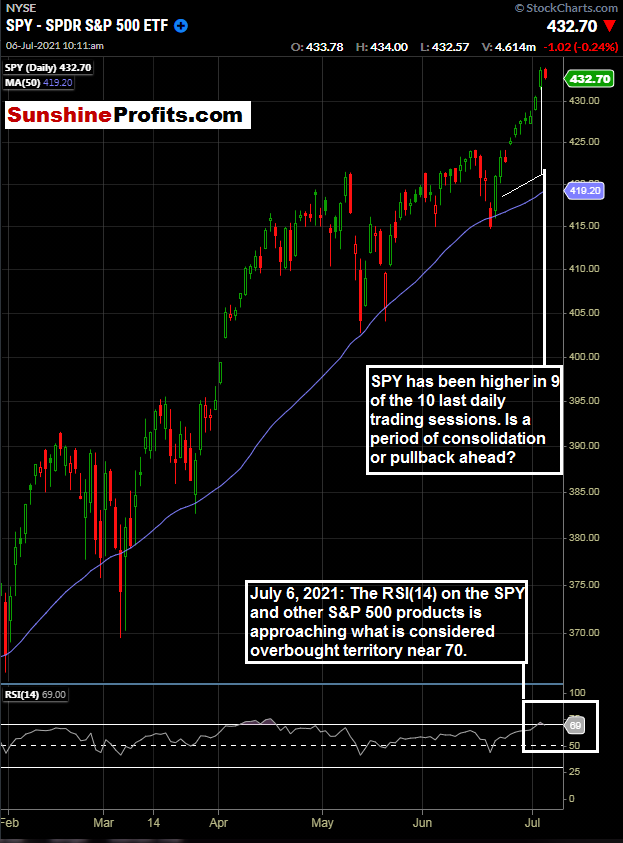
Figure 1 - SPDR S&P 500 ETF January 29, 2021 - July 6, 2021, 10:10 AM, Daily Candles Source stockcharts.com
A simple observation: The S&P 500 has been higher in nine of the ten last trading sessions. It has been unfadable and looking forward to this week on lighter volume; it may take a surprising catalyst to send the index lower in any meaningful fashion. We are approaching technically overbought levels according to RSI (14), but what could be a catalyst for substantially lower prices? Sideways consolidation could be the next theme in the short-term on light holiday week volume.
Given the expectations for the style of this week, and not wanting to chase an index higher that is approaching daily overbought levels (but not looking to get short either), we can look to particular stories and themes in order to find a potential opportunity.
Let’s Talk Banks & KBE
Now that we have the first Fed interest rate hike hint out of the way, we can think about bank stocks over the longer term. Higher interest rates can create net interest margin expansion for banks and can boost the bottom line.
Many bank stocks sold off on the Fed news initially (a buy the rumor sell the fact type trade). Now that we have pulled back a bit in the bank names, I begin analyzing ETFs for opportunities.
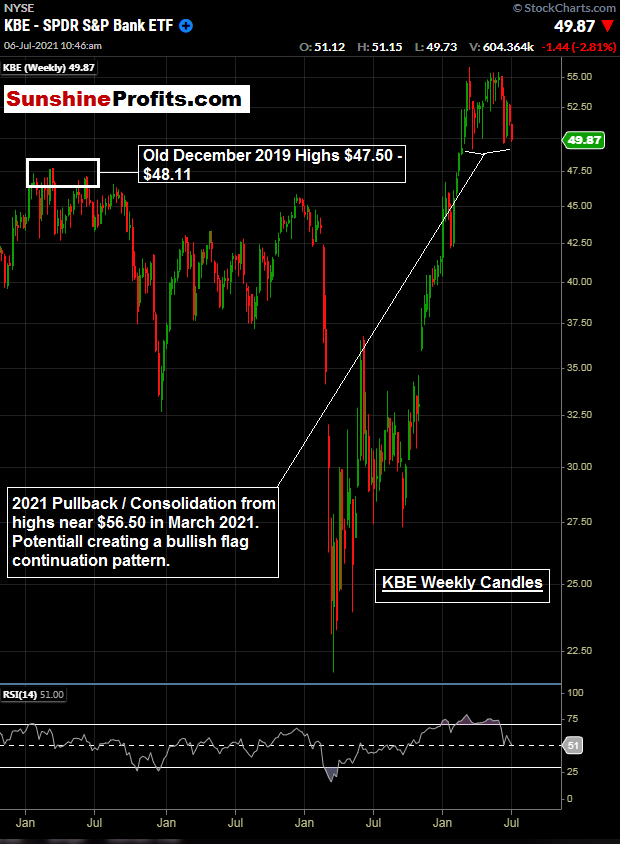
Figure 2- KBE S&P Bank ETF October 30, 2017 - July 6, 2021, Weekly Candles Source stockcharts.com
Above, we have the KBE S&P Bank ETF. You may be thinking - banks? They are so boring! The truth is I do like boring. There is a meaningful pullback off the highs in the banking sector of the S&P 500 already. We like to buy pullbacks in bull markets, right? The above chart is a weekly chart, and we can see that the price is approaching the previous highs made in late 2019 and that we are at the bottom of the most recent consolidation range.
Perhaps a quieter S&P 500 this week can provide an opportunity in an ETF that has pulled back over 9% from its 2021 highs; as the S&P 500 has continued to make new highs.
Turning to the Daily Charts:
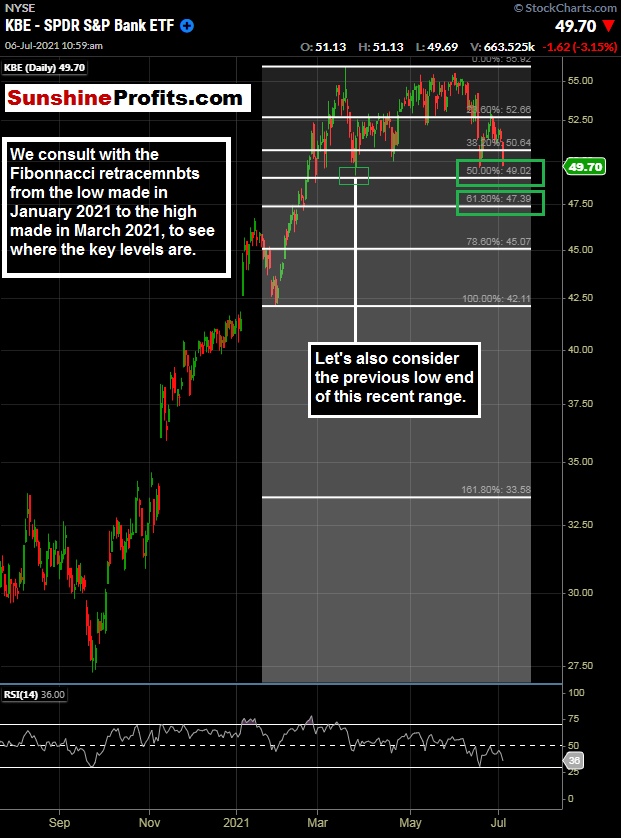
Figure 3- KBE S&P Bank ETF September 1, 2020 - July 6, 2021, Daily Candles Source stockcharts.com
We have several levels to consider here. First, we are very close to the recent low point of the consolidation range ($49.15) combined with the 50% Fibonacci retracement level of $49.02.
However, what if the broader market finally pulls back/consolidates? A move lower could give us a dip in the KBE, potentially to the 2019 highs near $48. This pullback could be soon and could coincide with a daily RSI (14) reading at oversold levels near 30 or lower.
That’s the kind of stuff I like to see, and I like having a plan in place for when it happens. I like looking at the key 61.8% retracement level of $47.39 and the 2019 highs of $48.11.
Now, since we are covering so many markets, let’s start the week off correctly and see where the nine covered markets are trading for Premium Subscribers.
Related: Getting a TAN and Sticking with Working Strategies
The views and opinions expressed in this article are those of the contributor, and do not represent the views of IRIS Media Works and Advisorpedia. Readers should not consider statements made by the contributor as formal recommendations and should consult their financial advisor before making any investment decisions. To read our full disclosure, please click here.